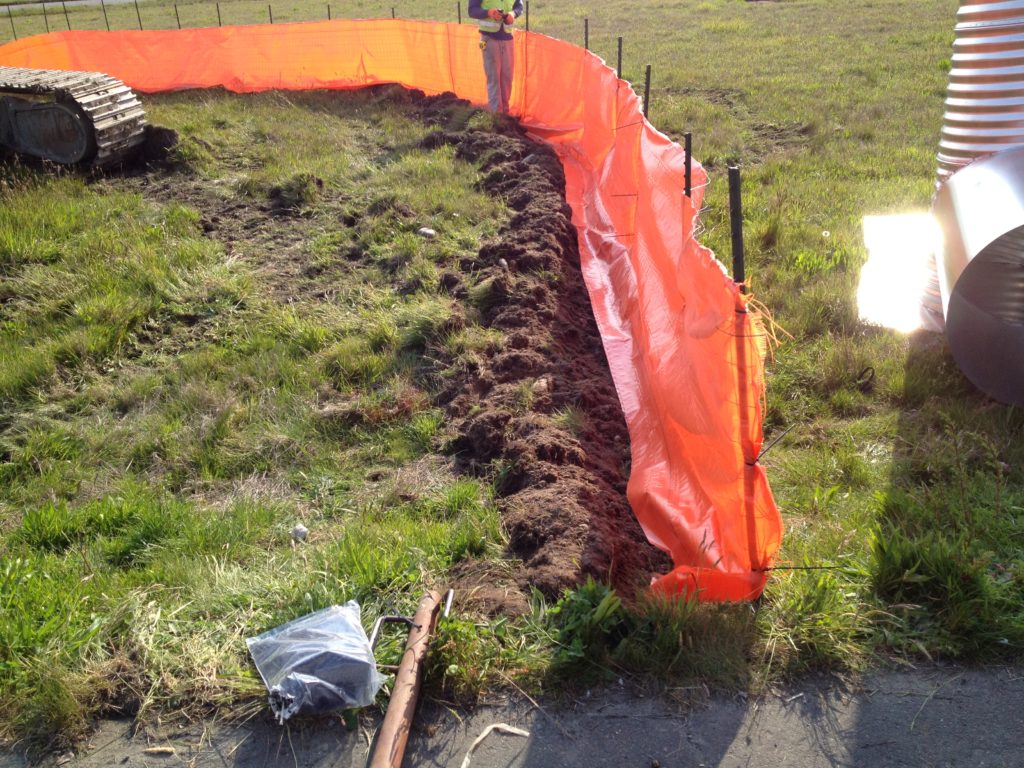
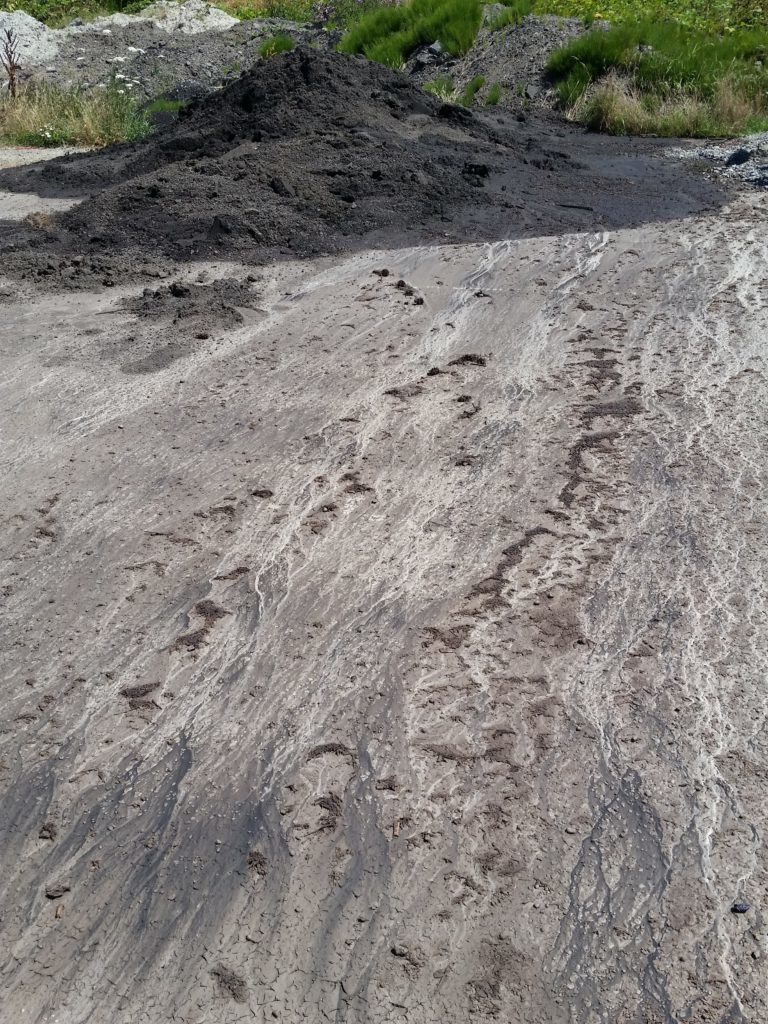
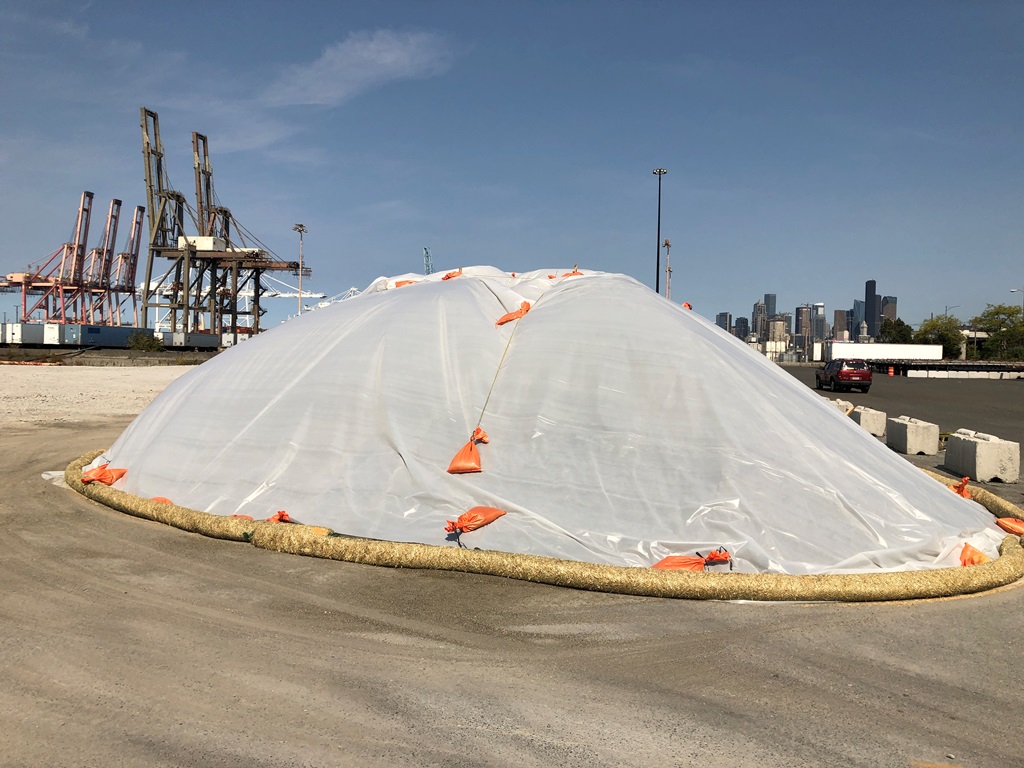
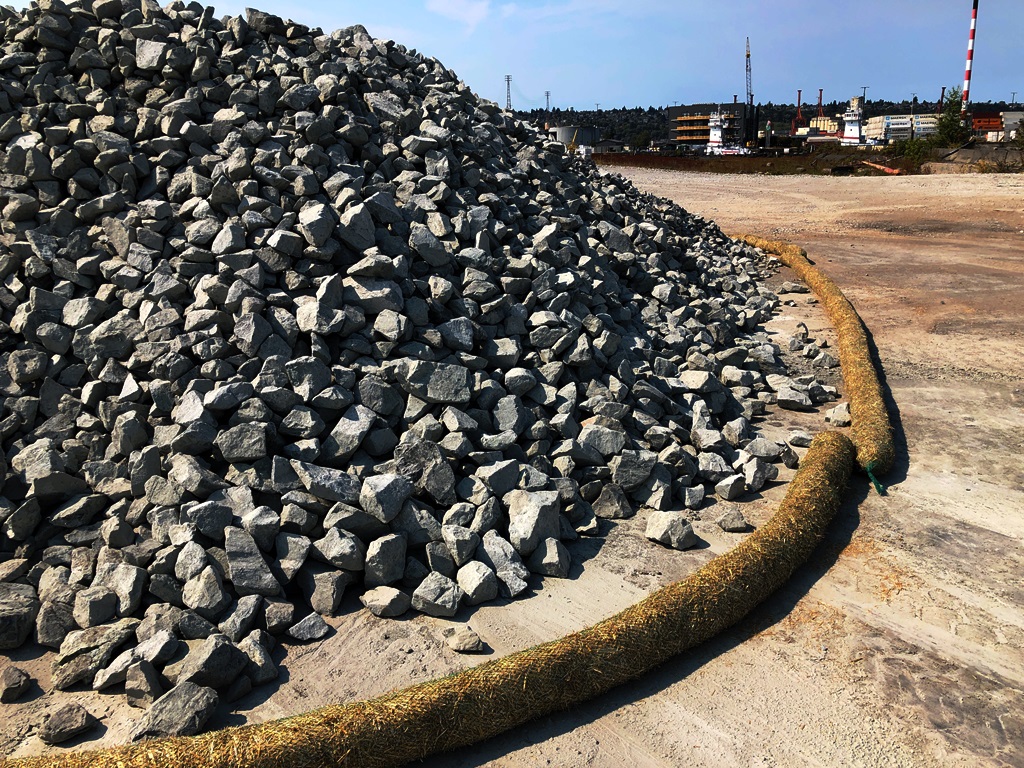
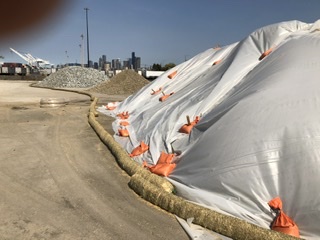
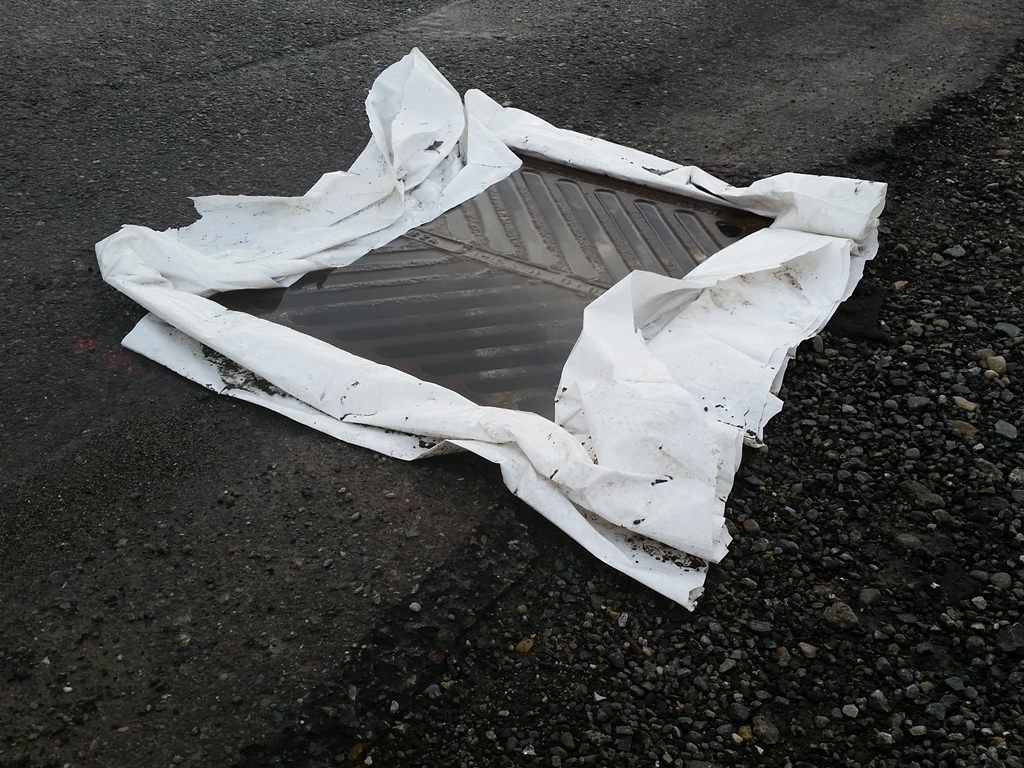
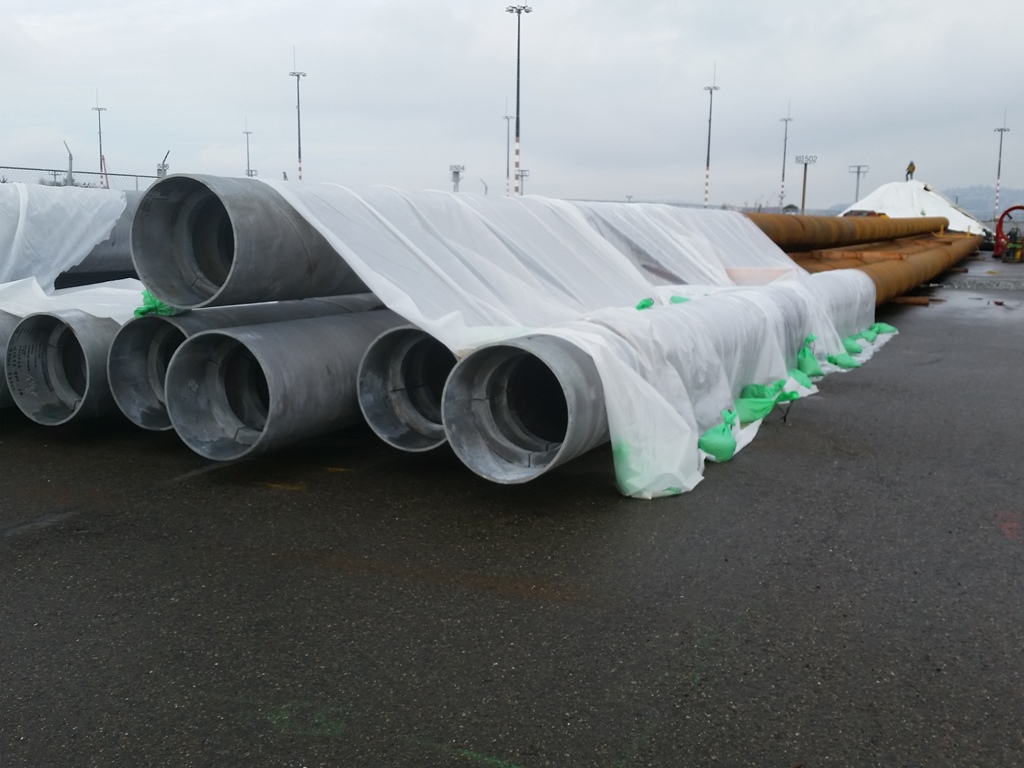
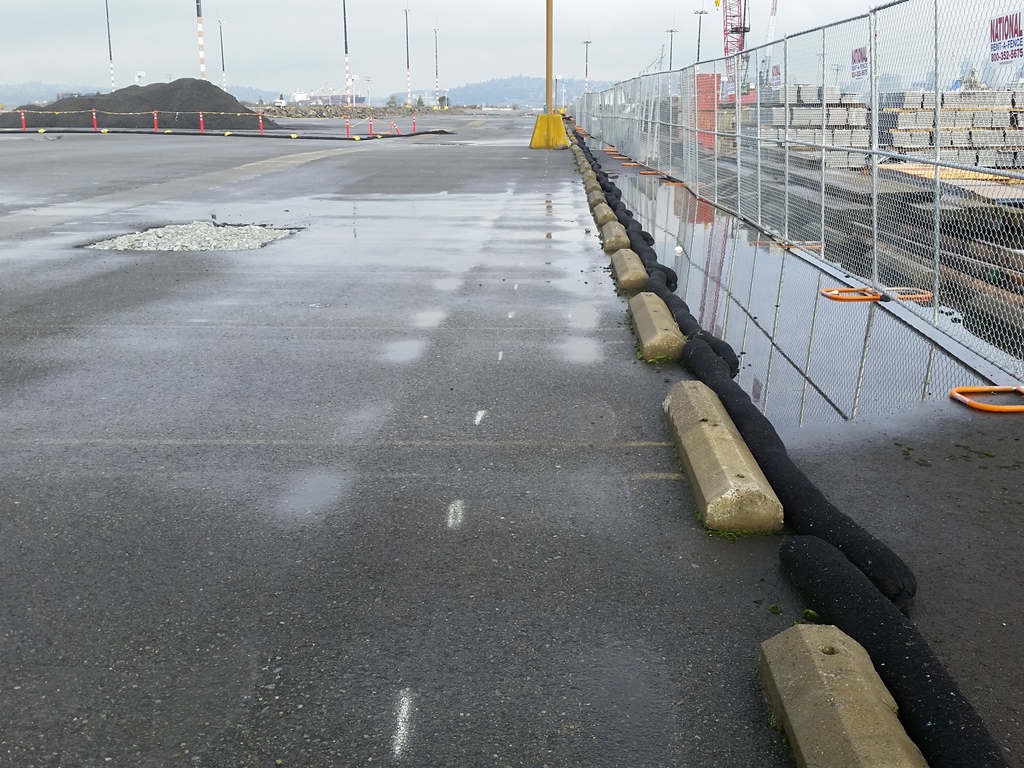
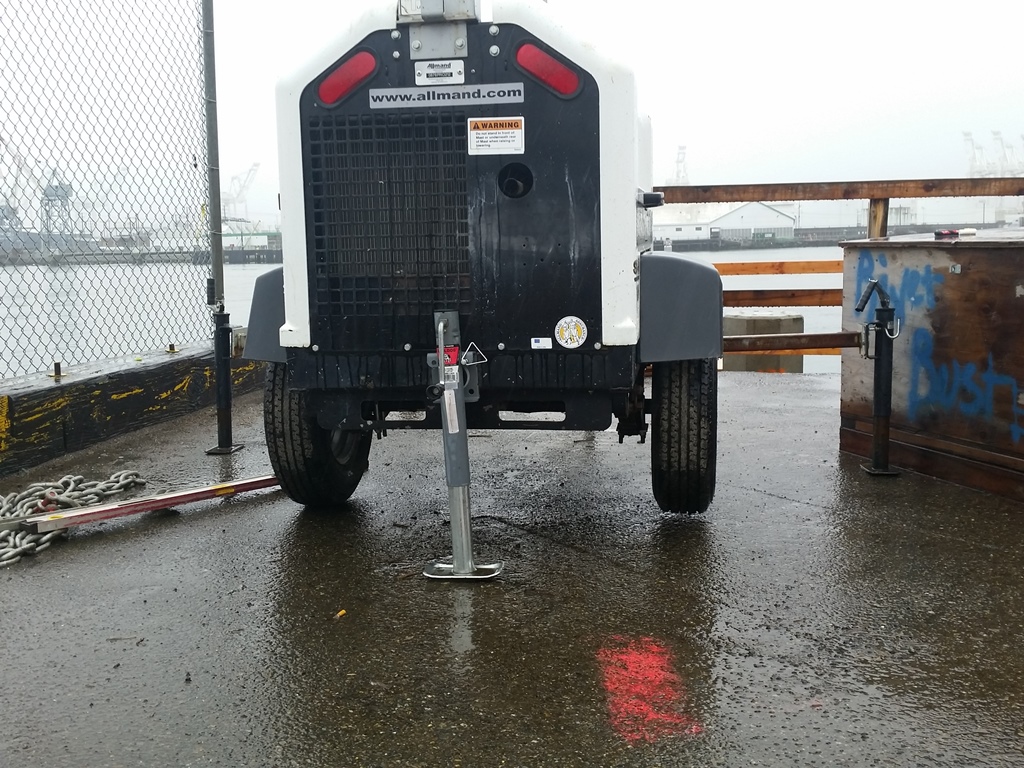
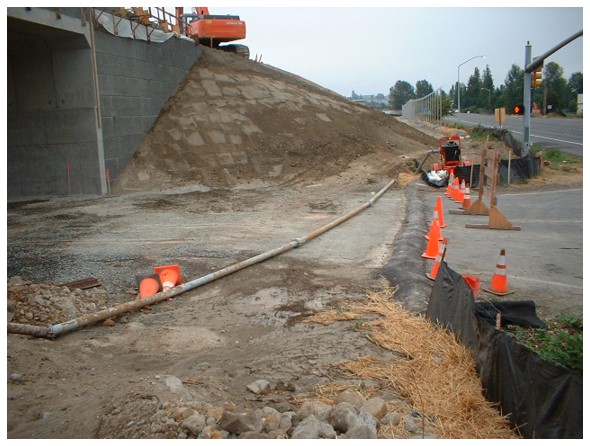
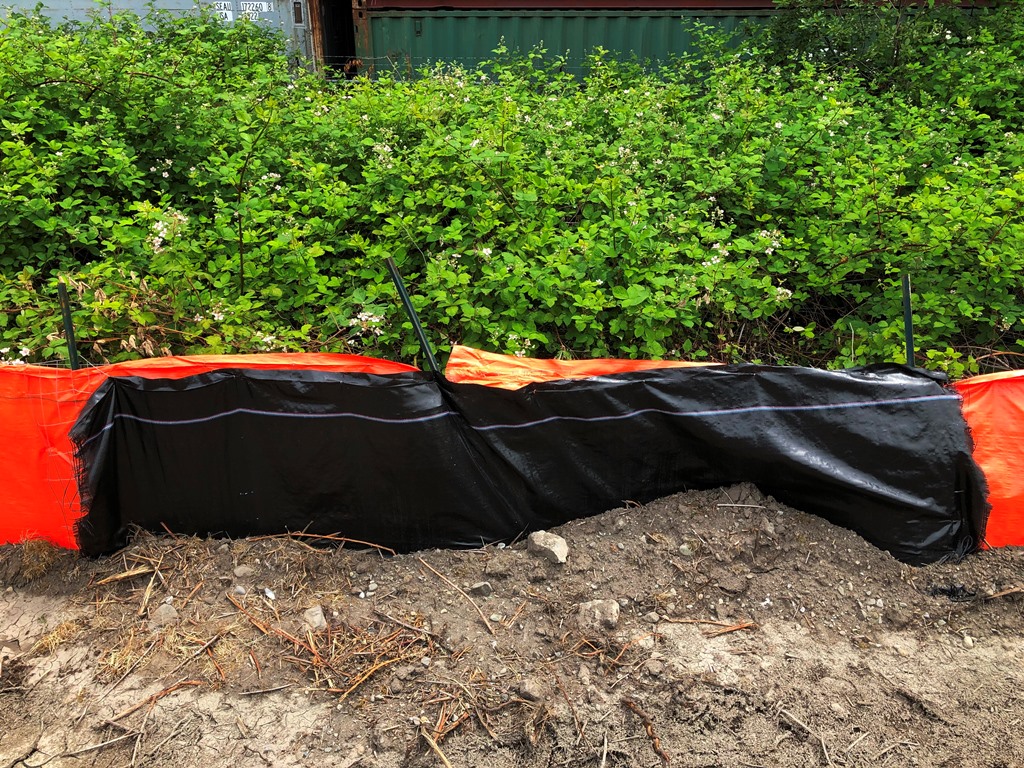
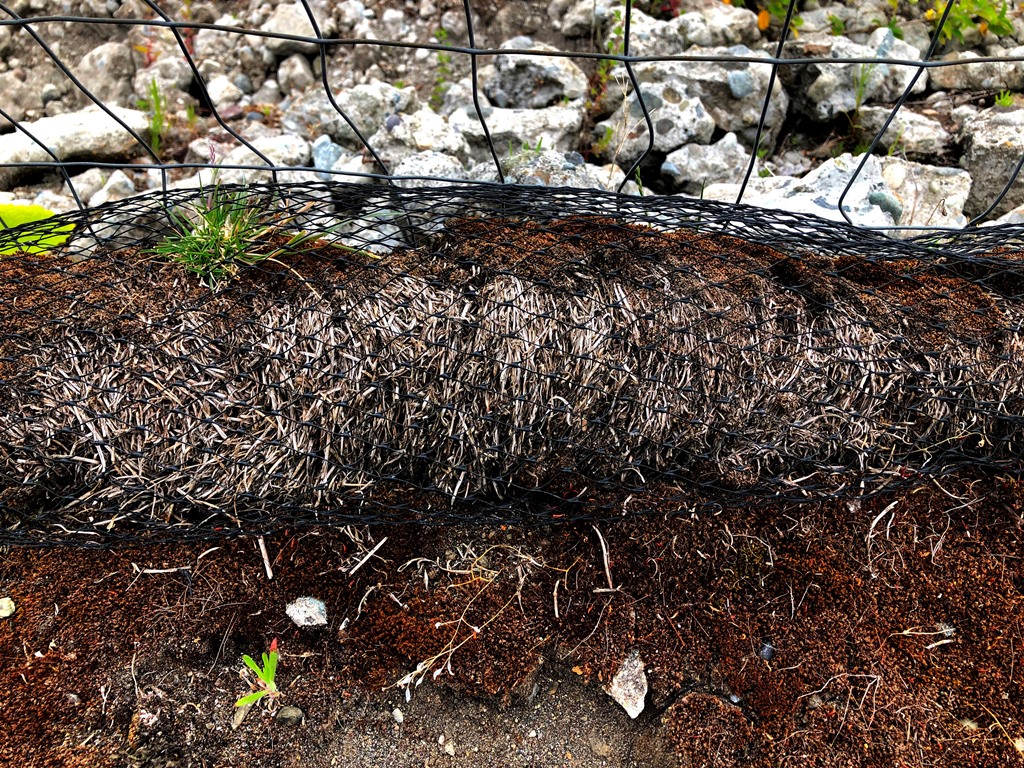
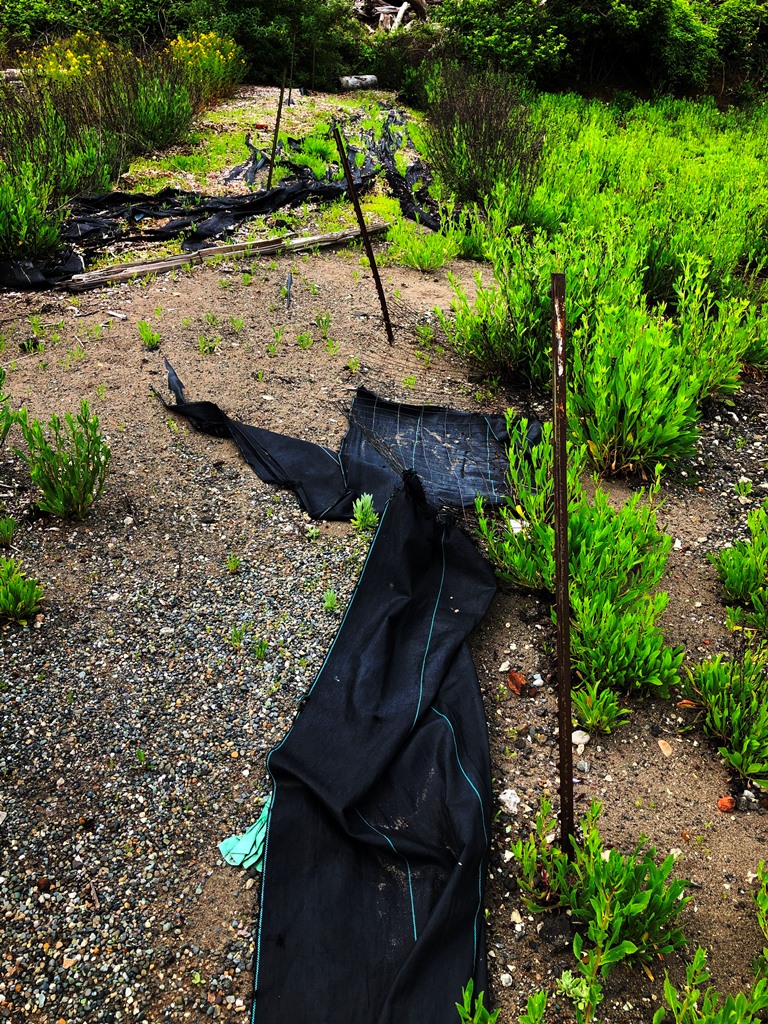
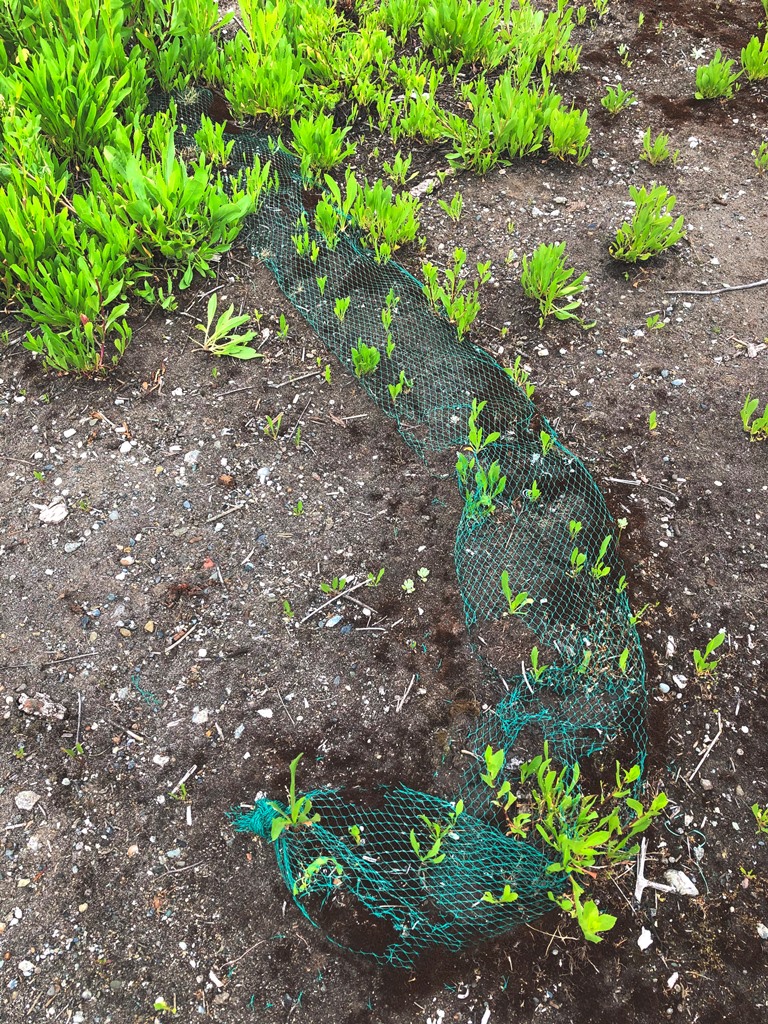
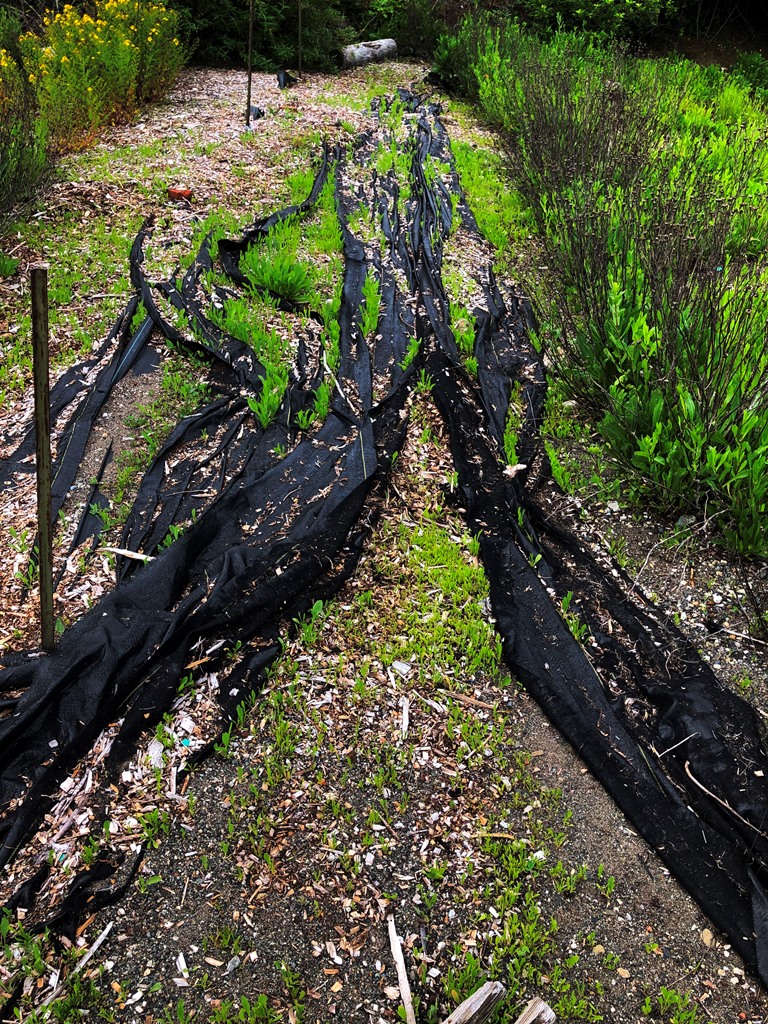
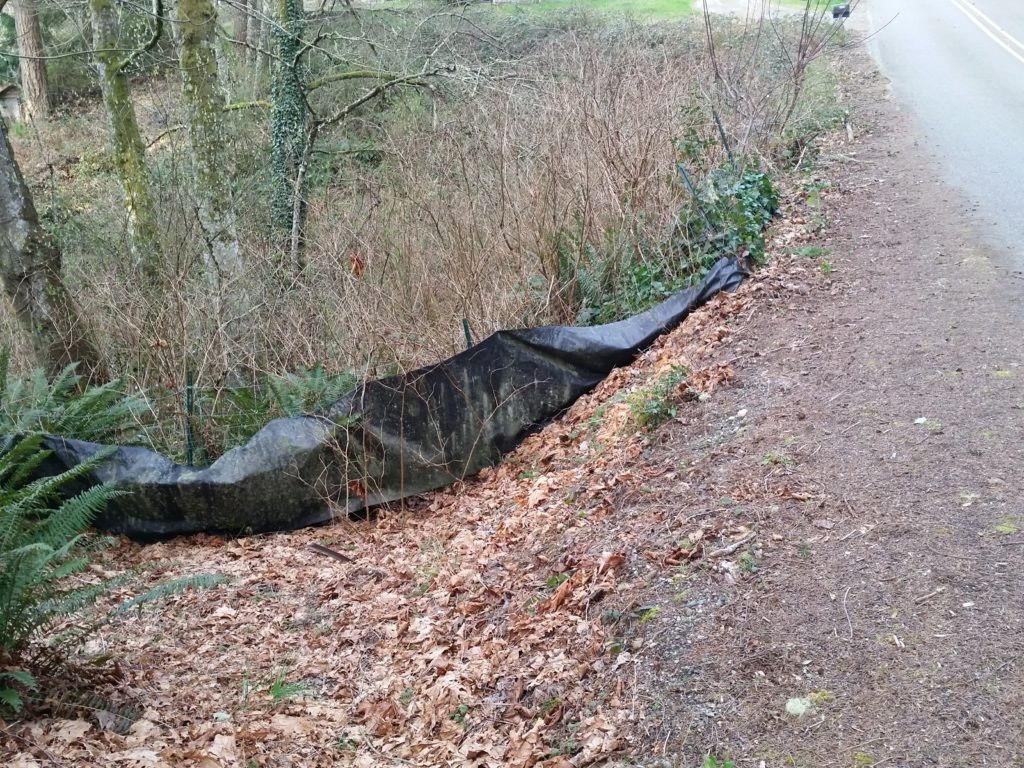
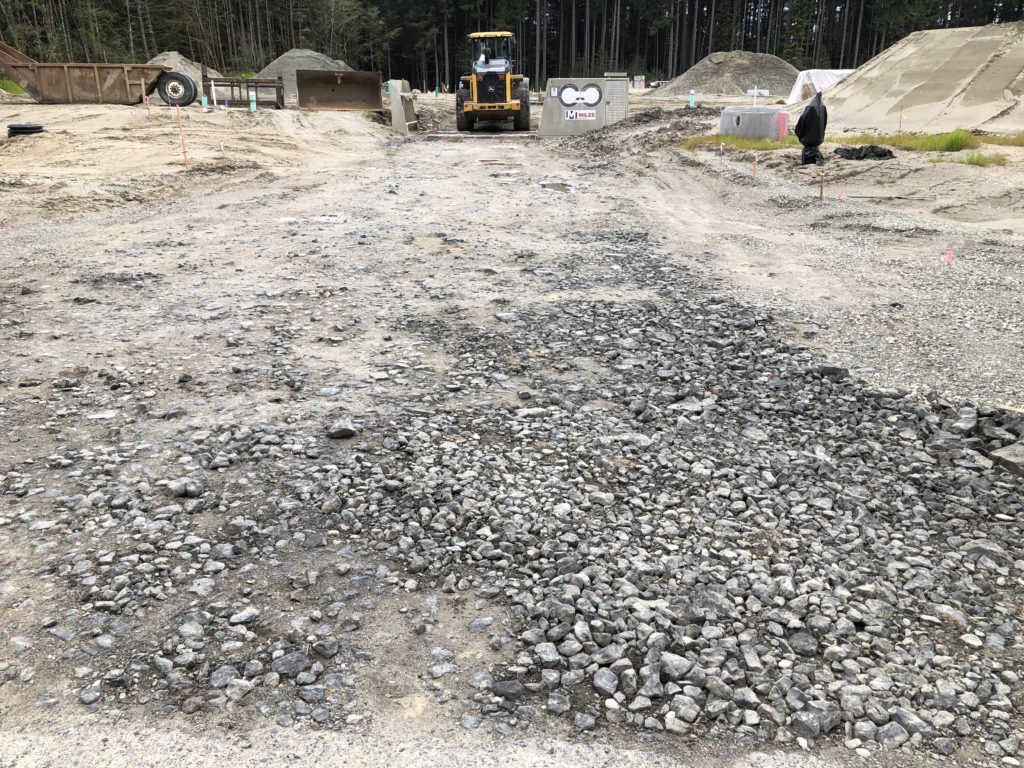
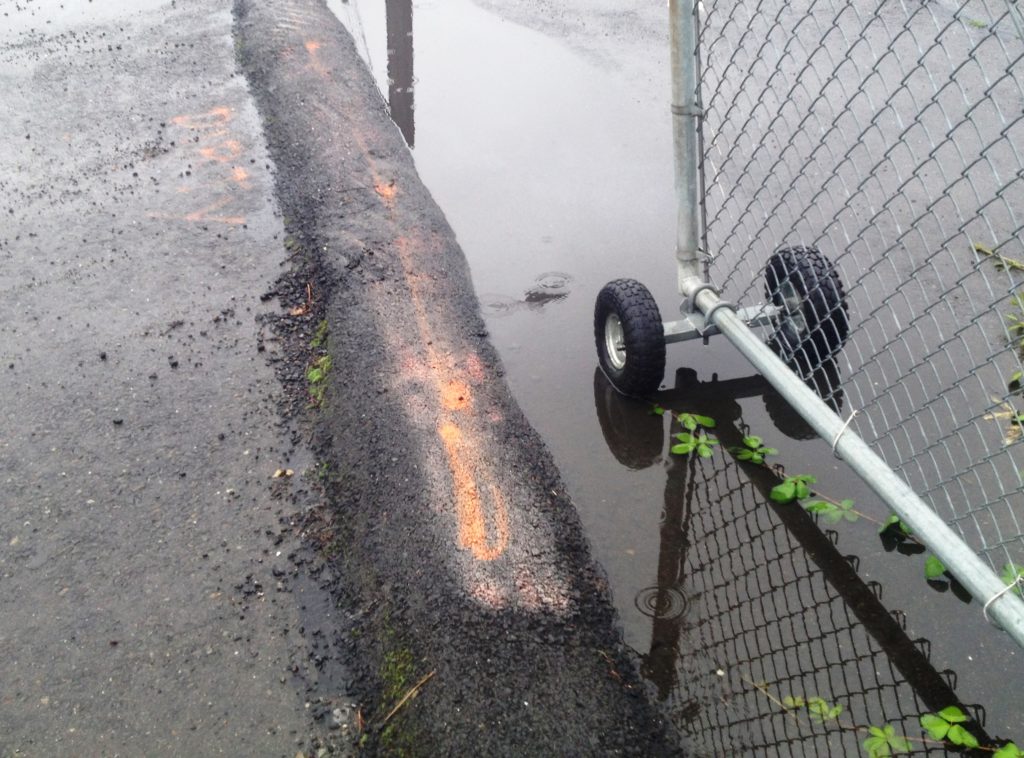
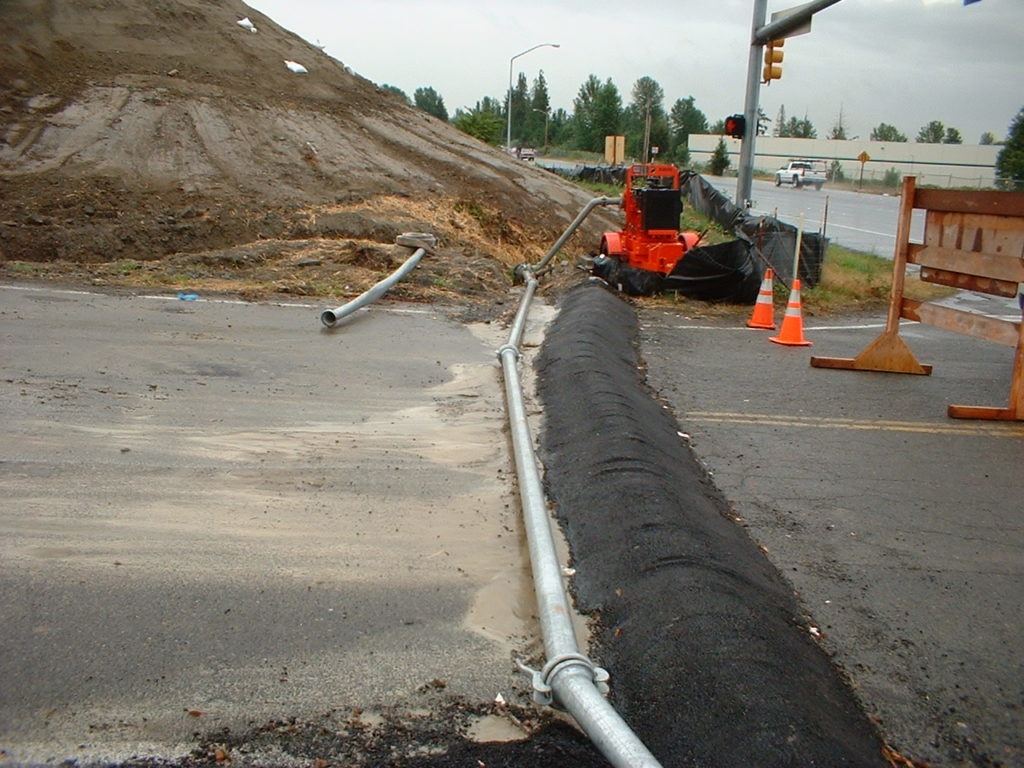
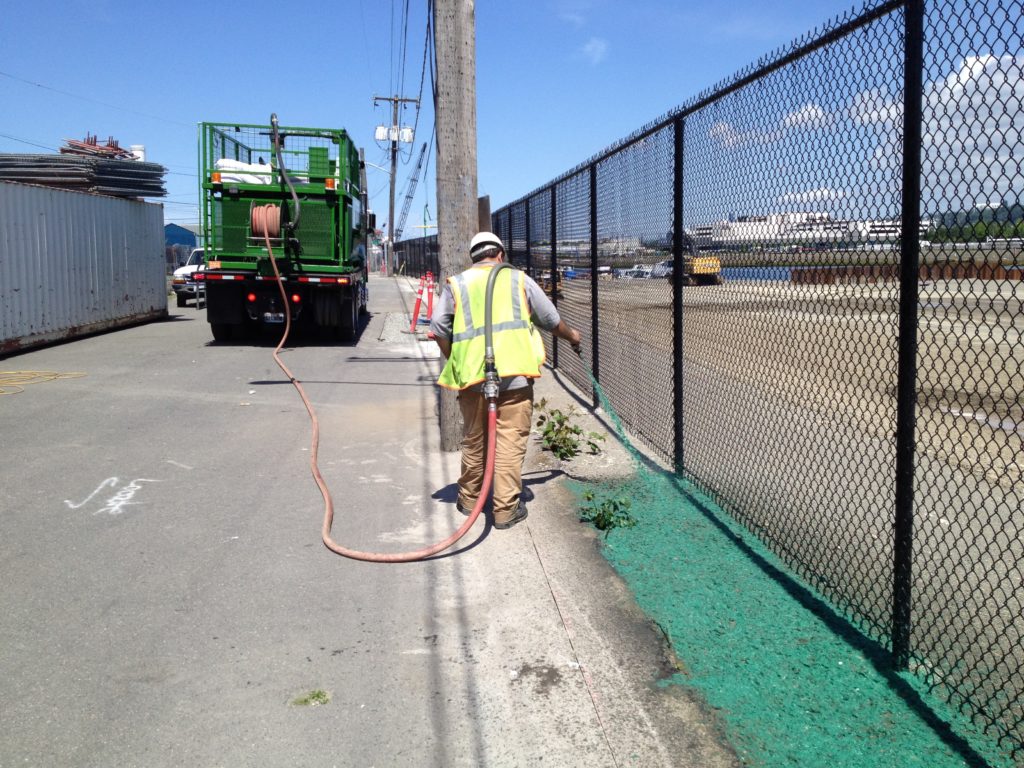
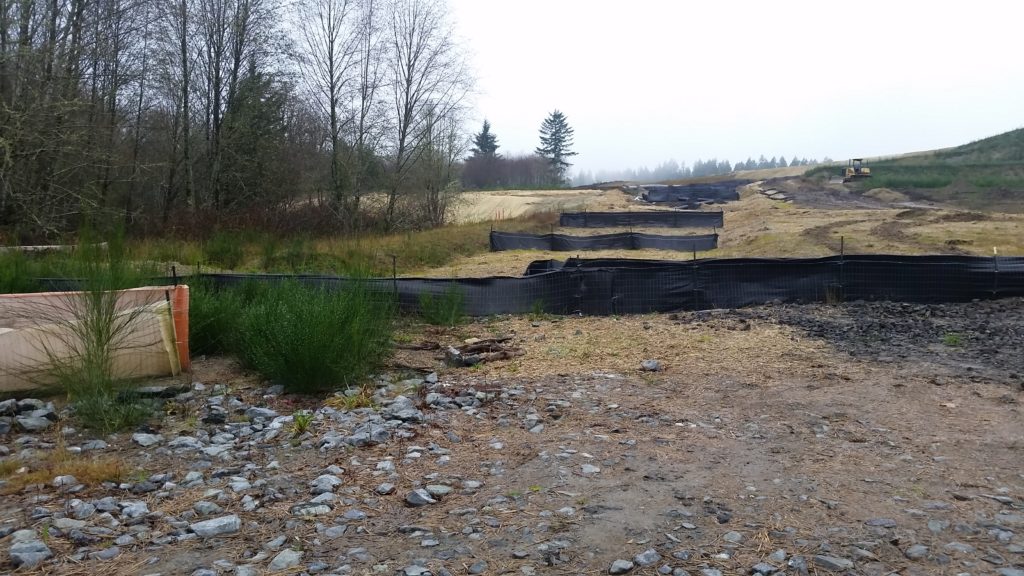
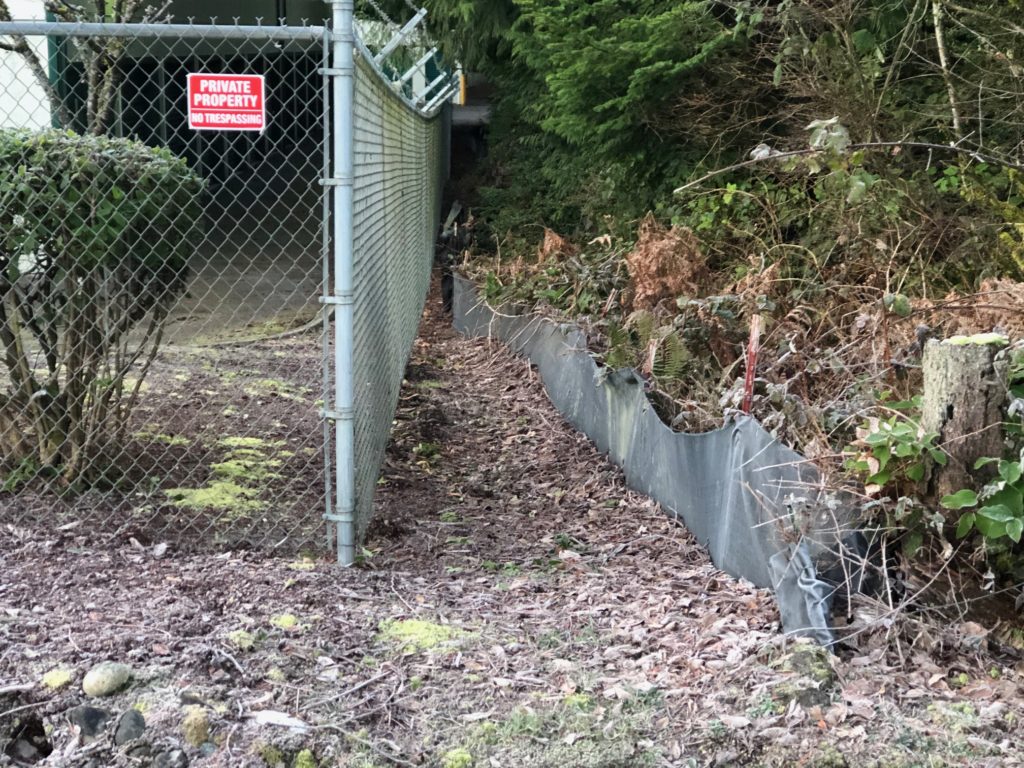
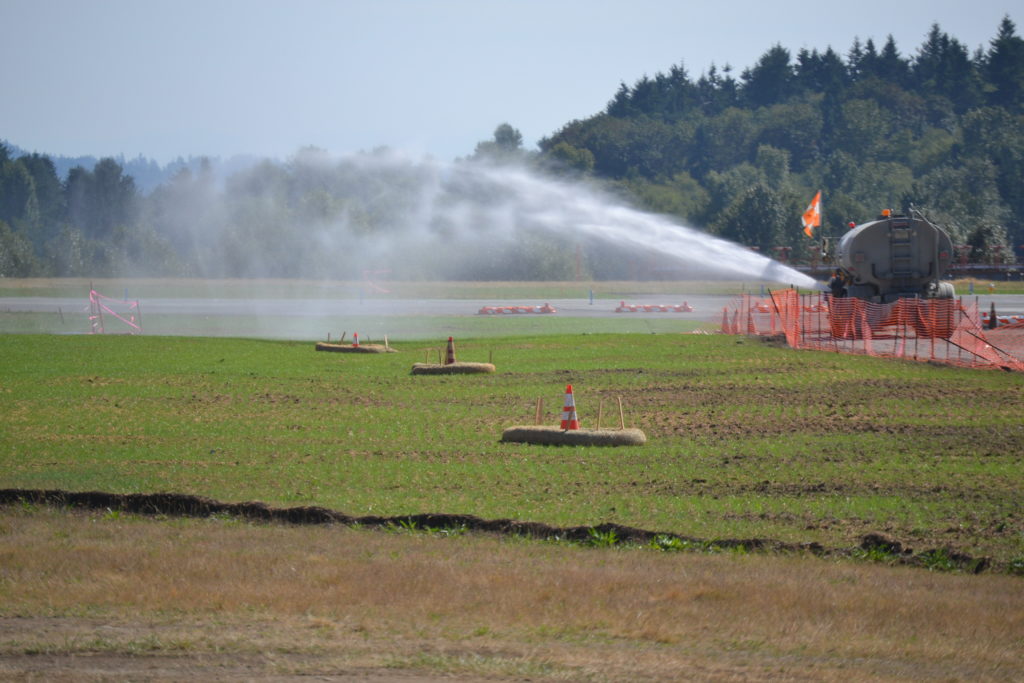
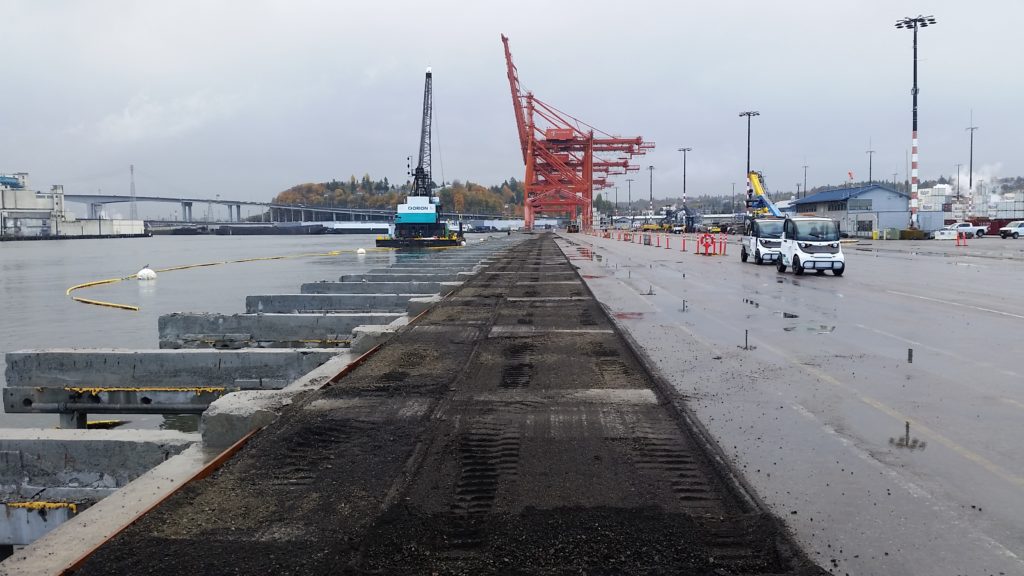
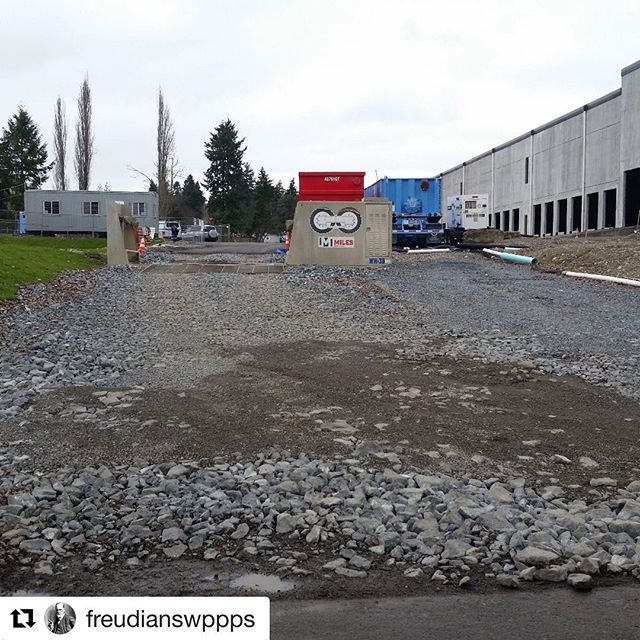
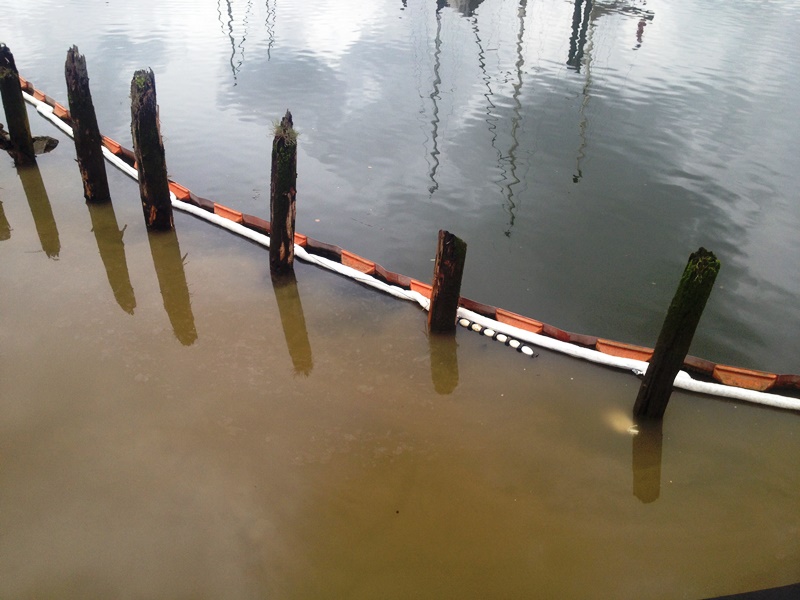
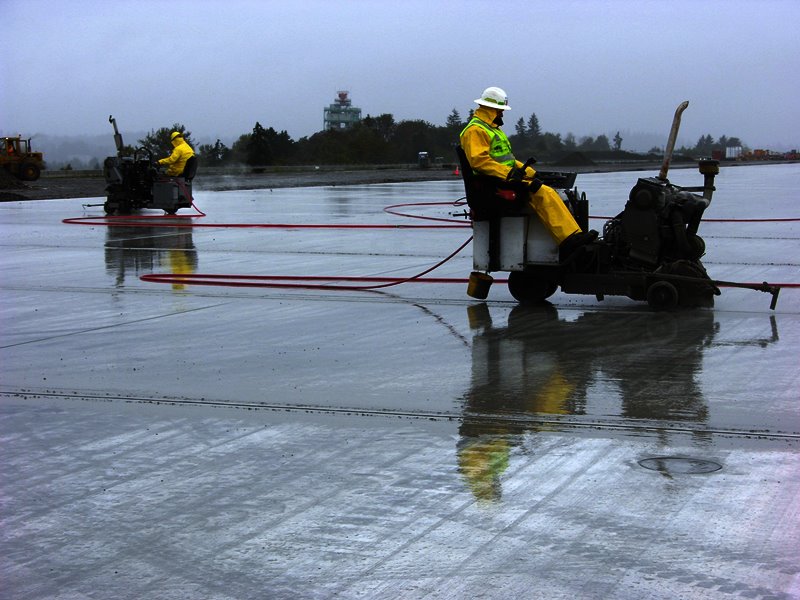
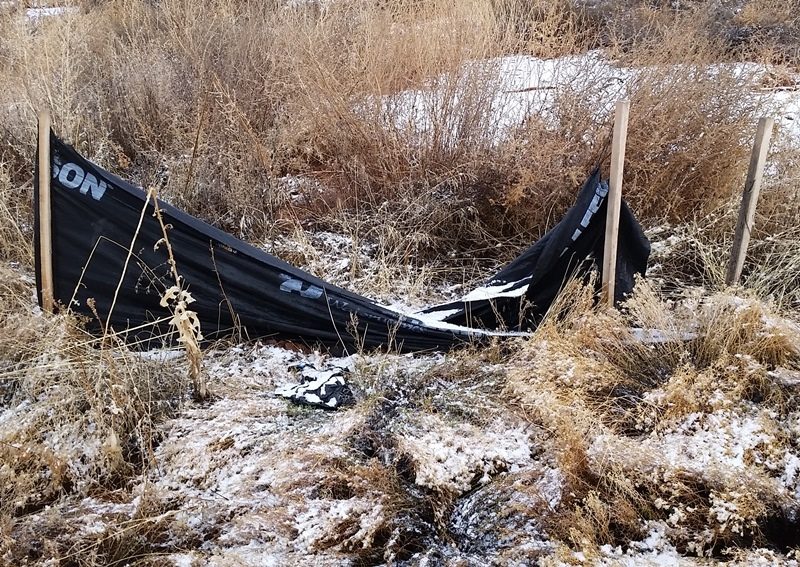
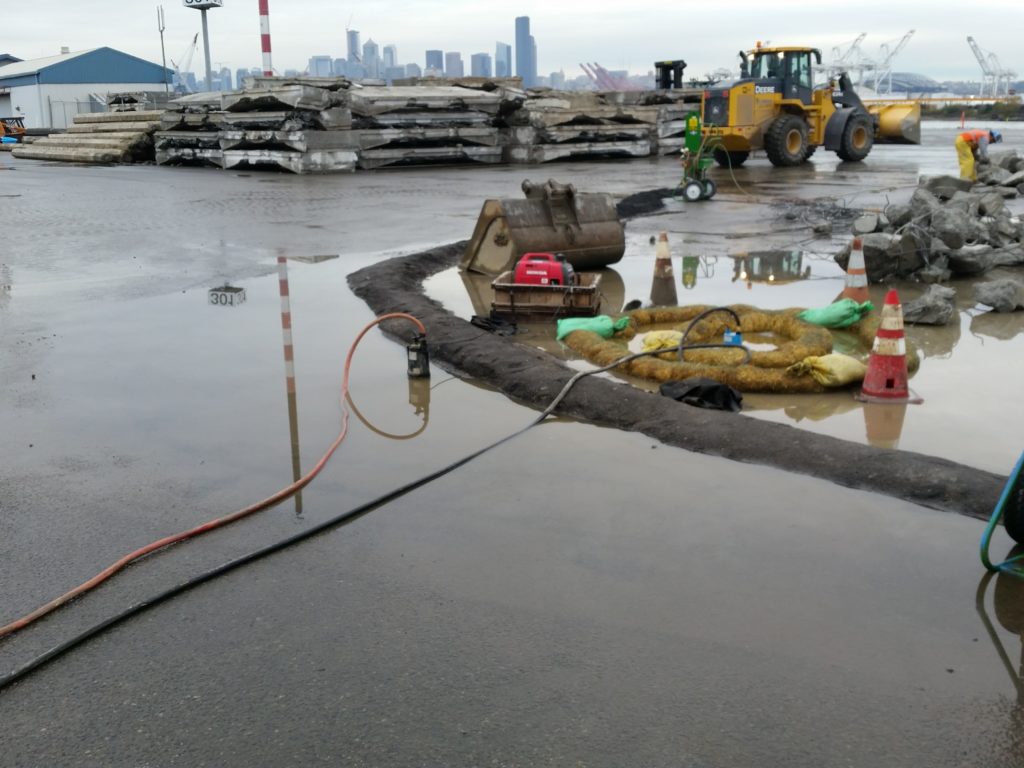
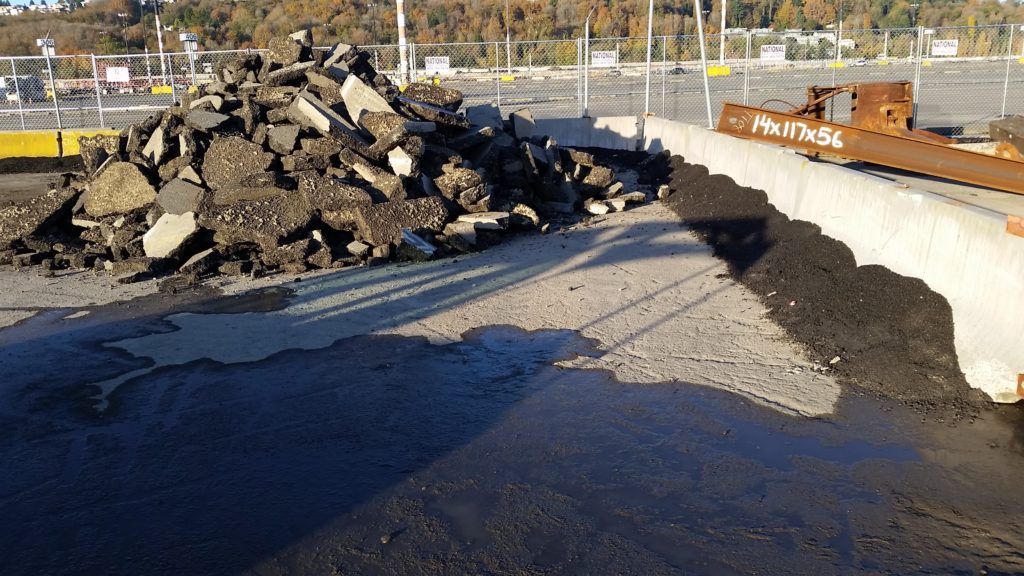
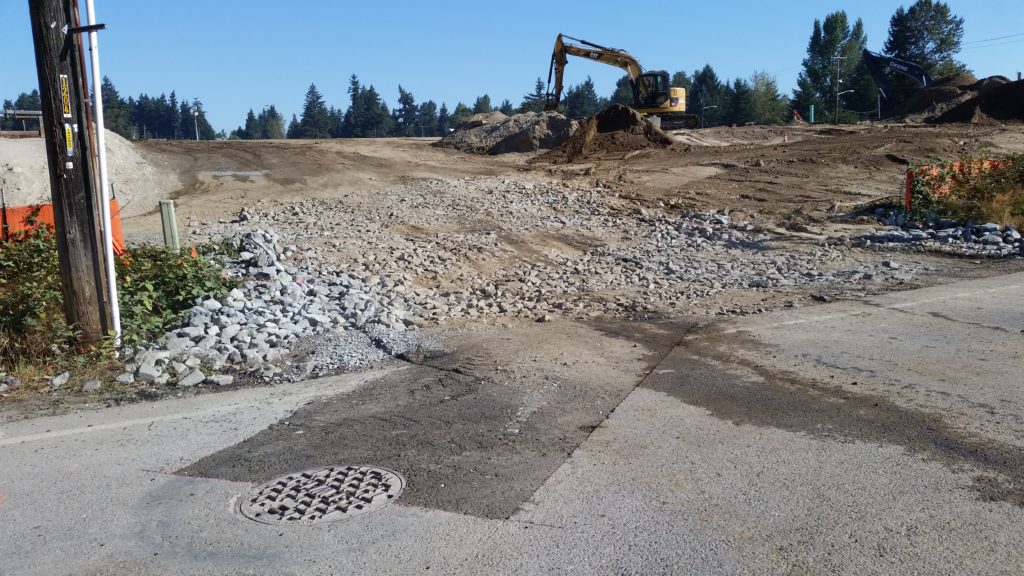
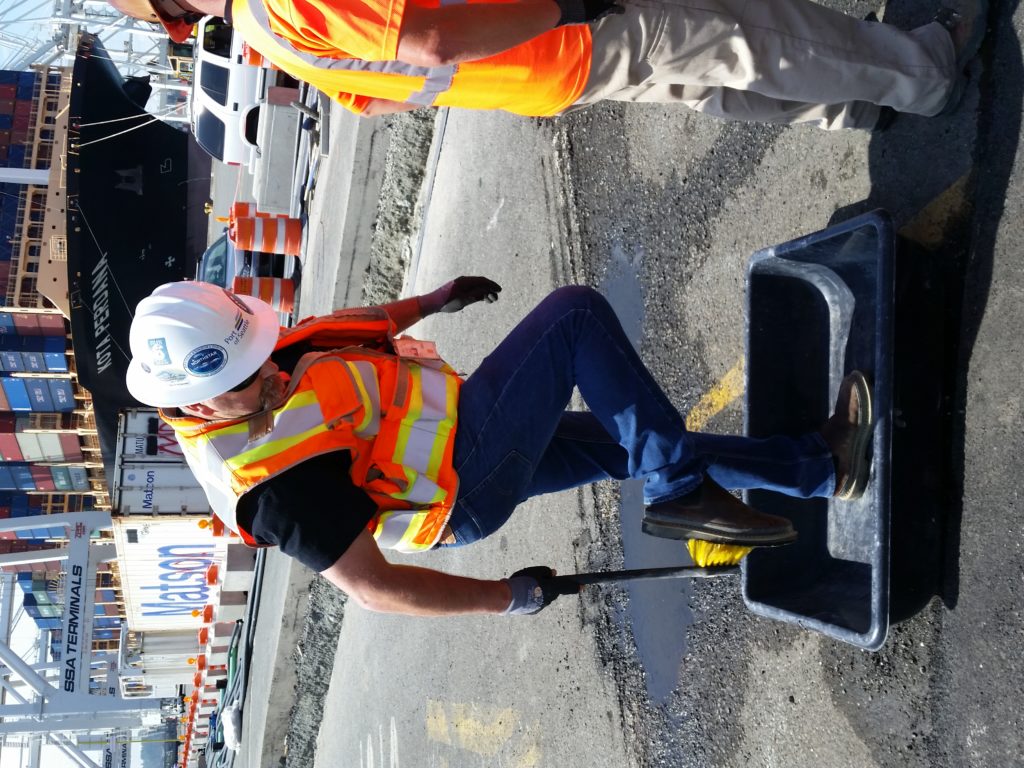
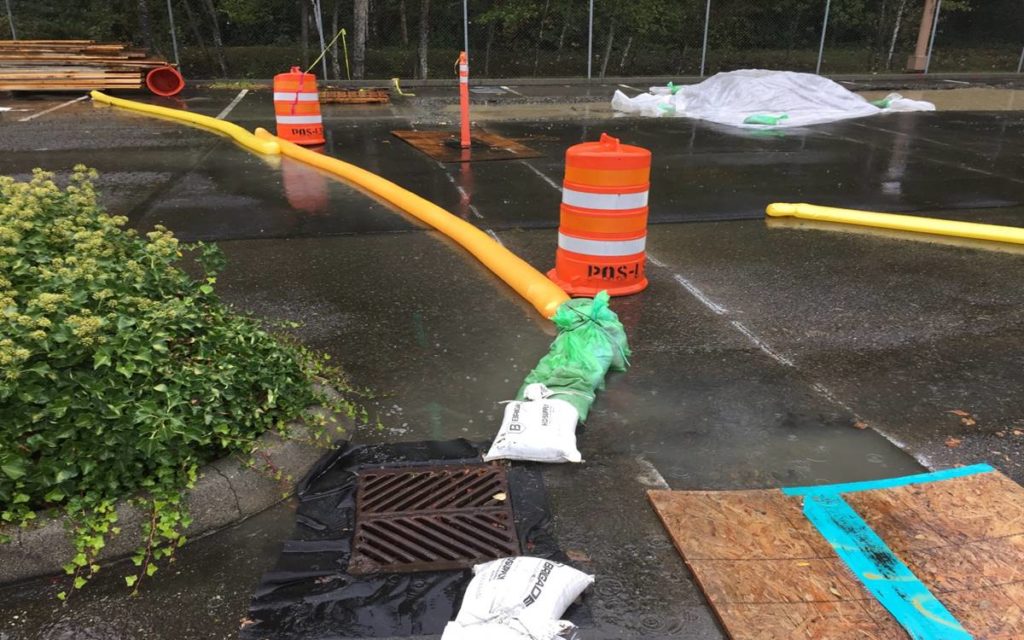
This silt fence is being installed to contain a five acre crushed concrete pile. It is trenched in, staked every six feet, has wire backing and uses zip ties to secure it to the stakes.
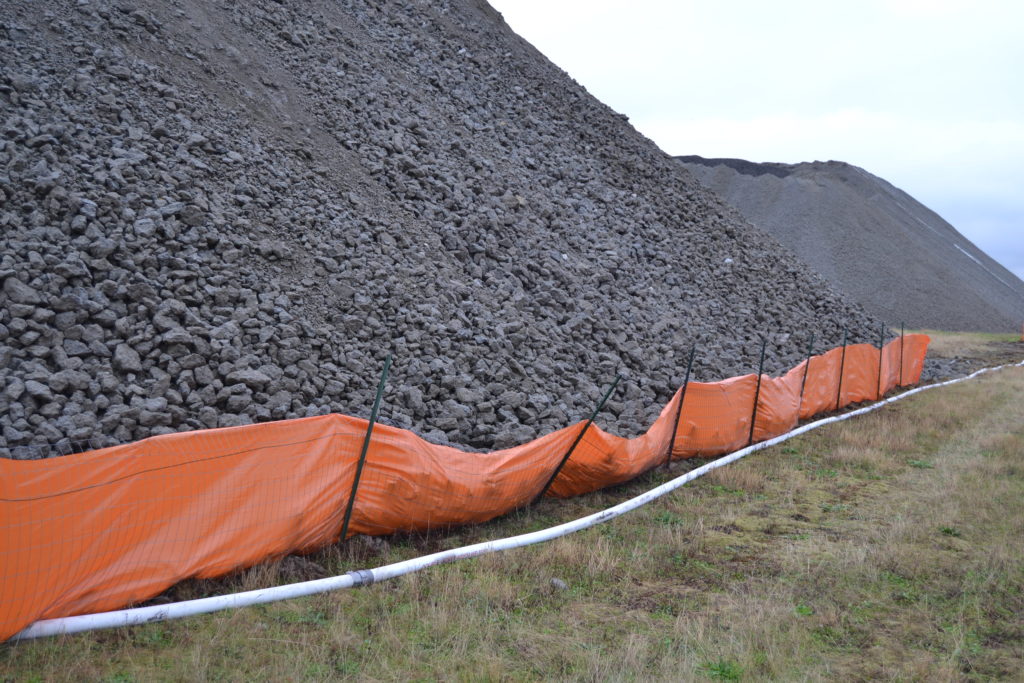
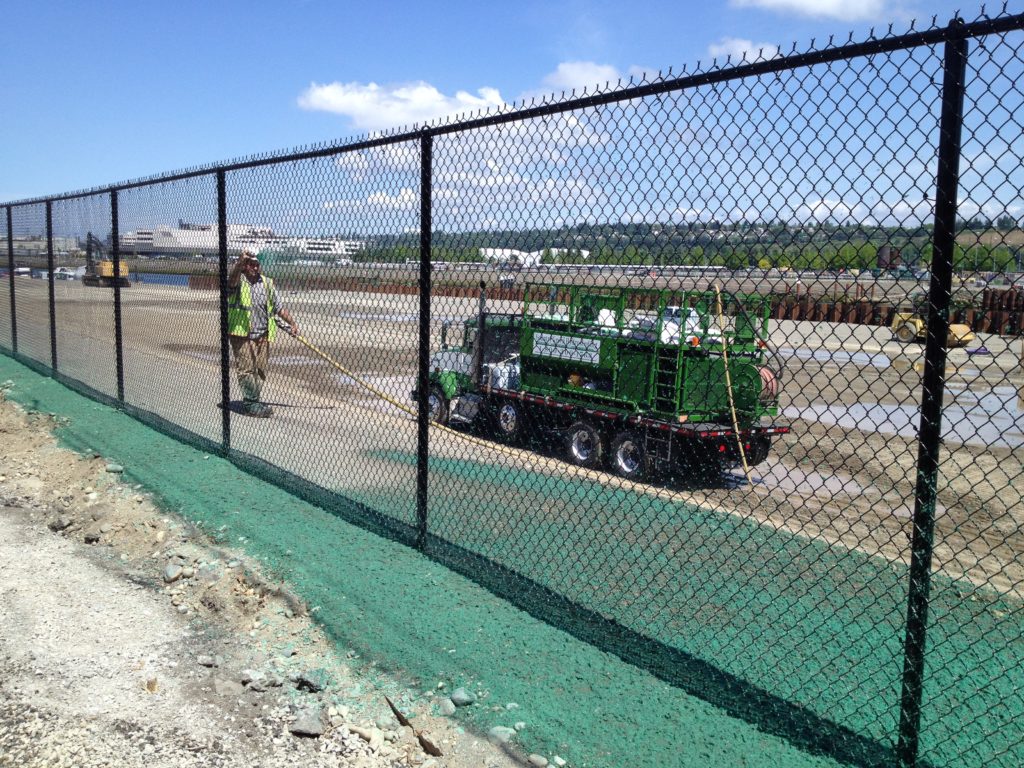
This silt fence is being installed to contain a five acre crushed concrete pile. It is trenched in, staked every six feet, has wire backing and uses zip ties to secure it to the stakes.

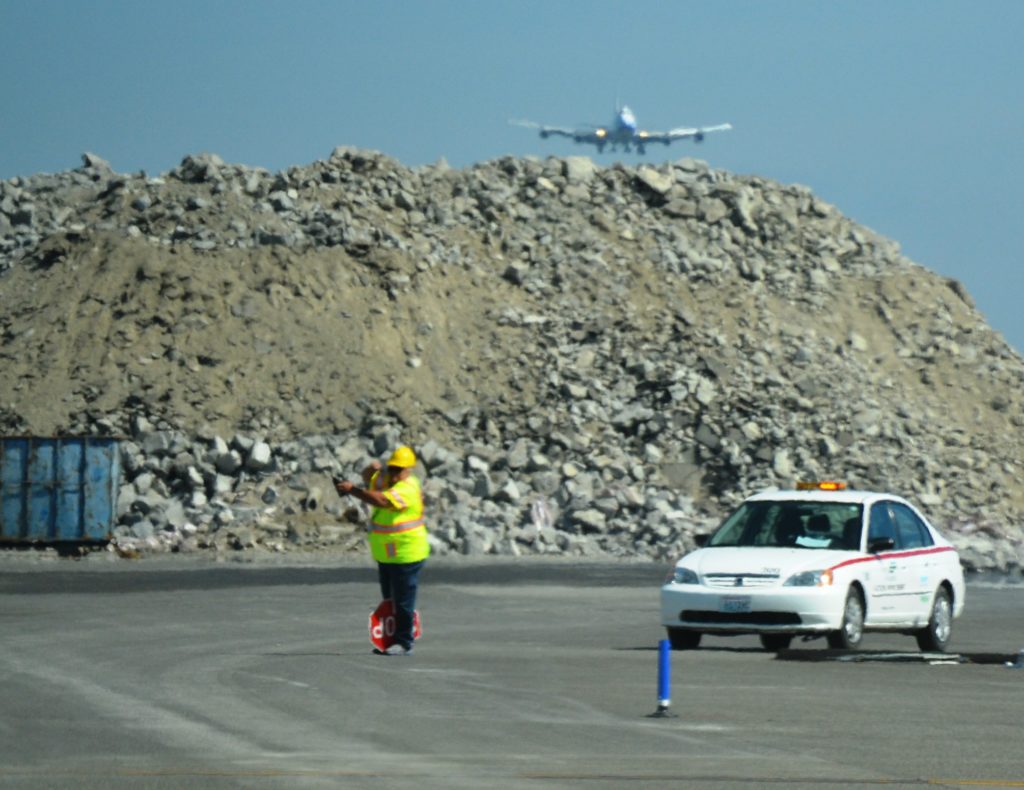
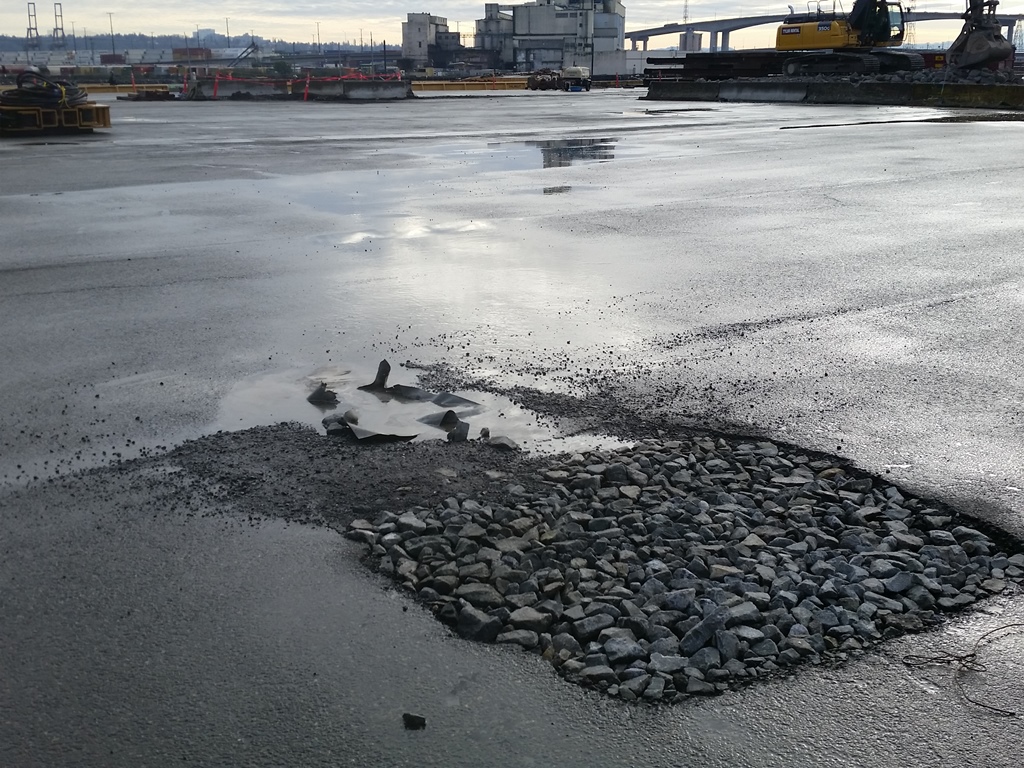
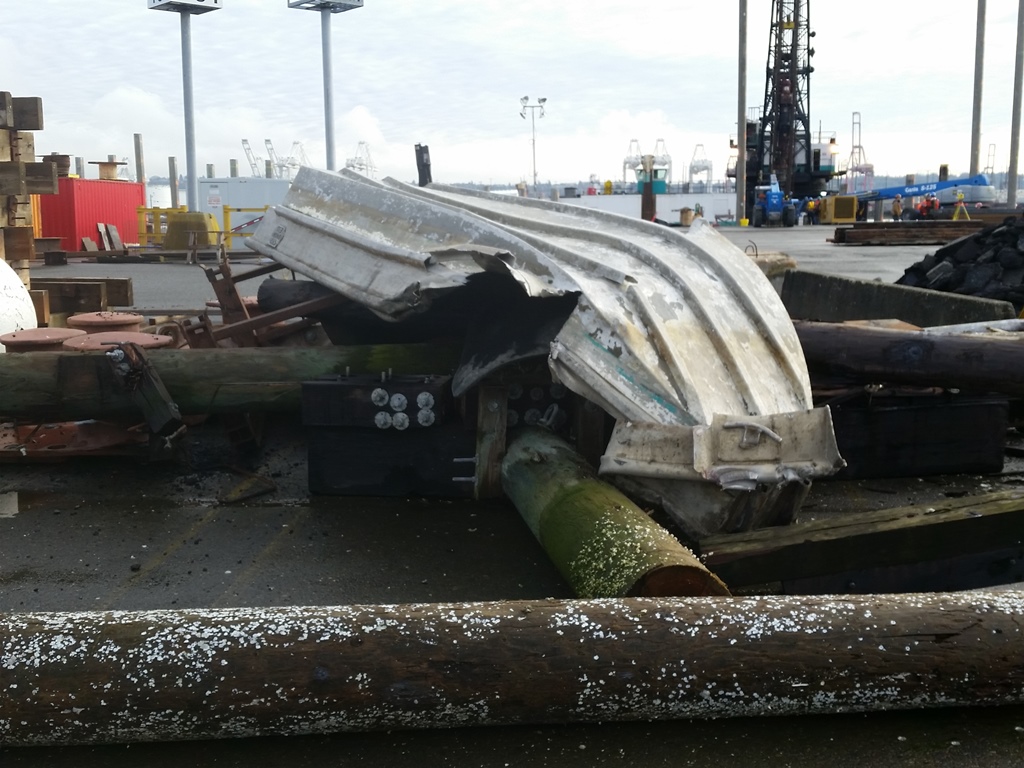
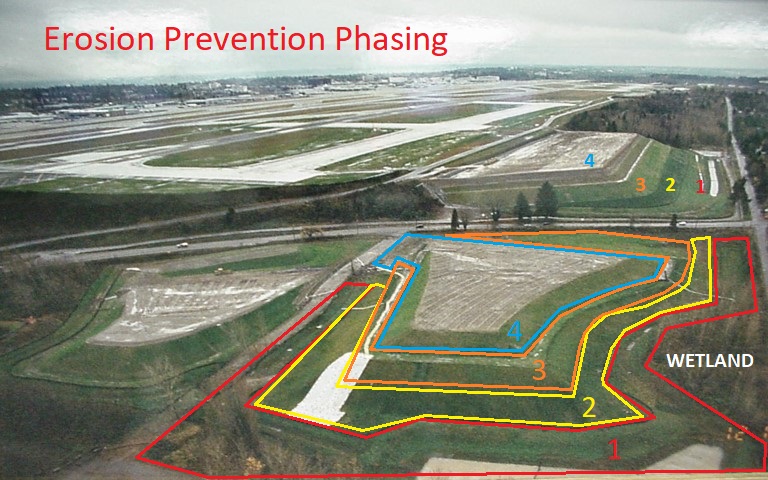
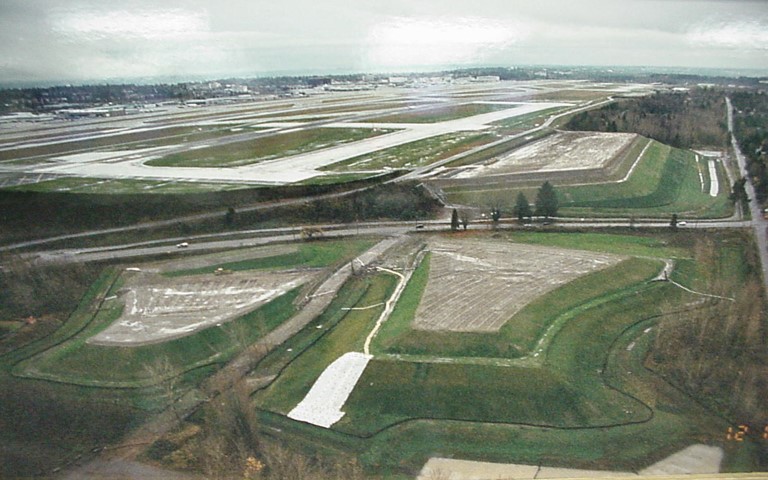
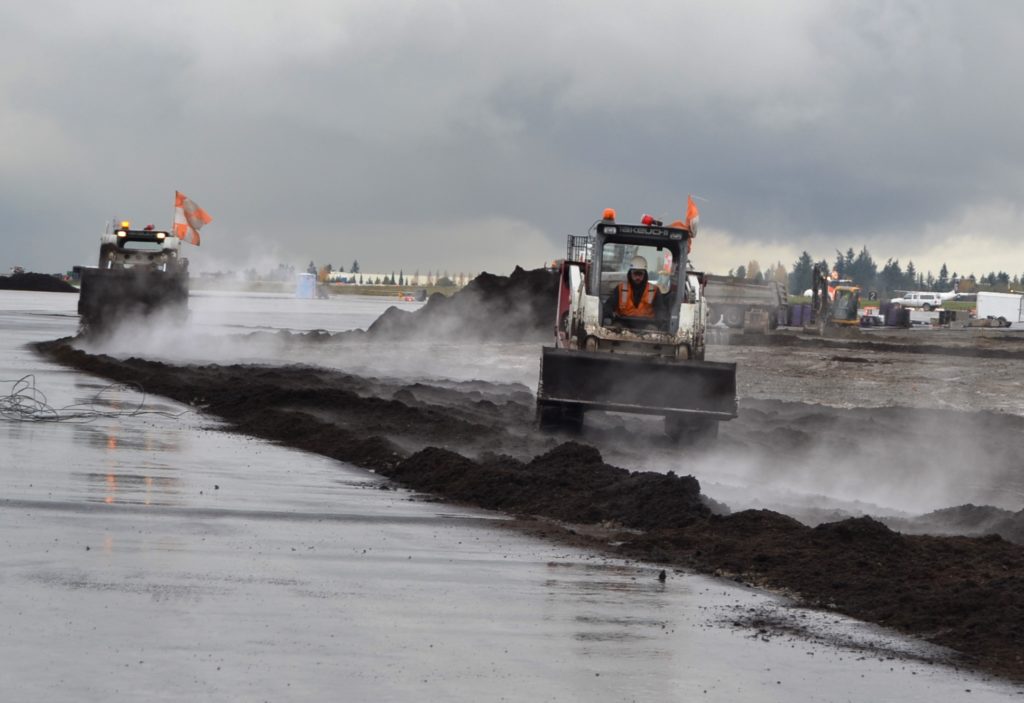
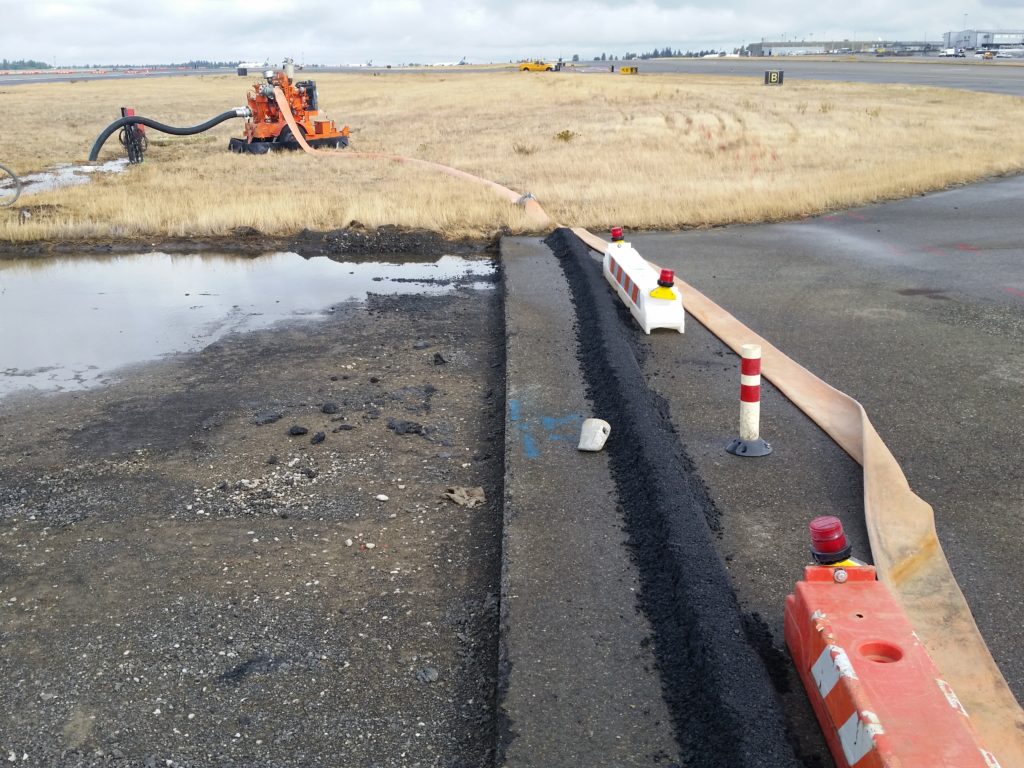
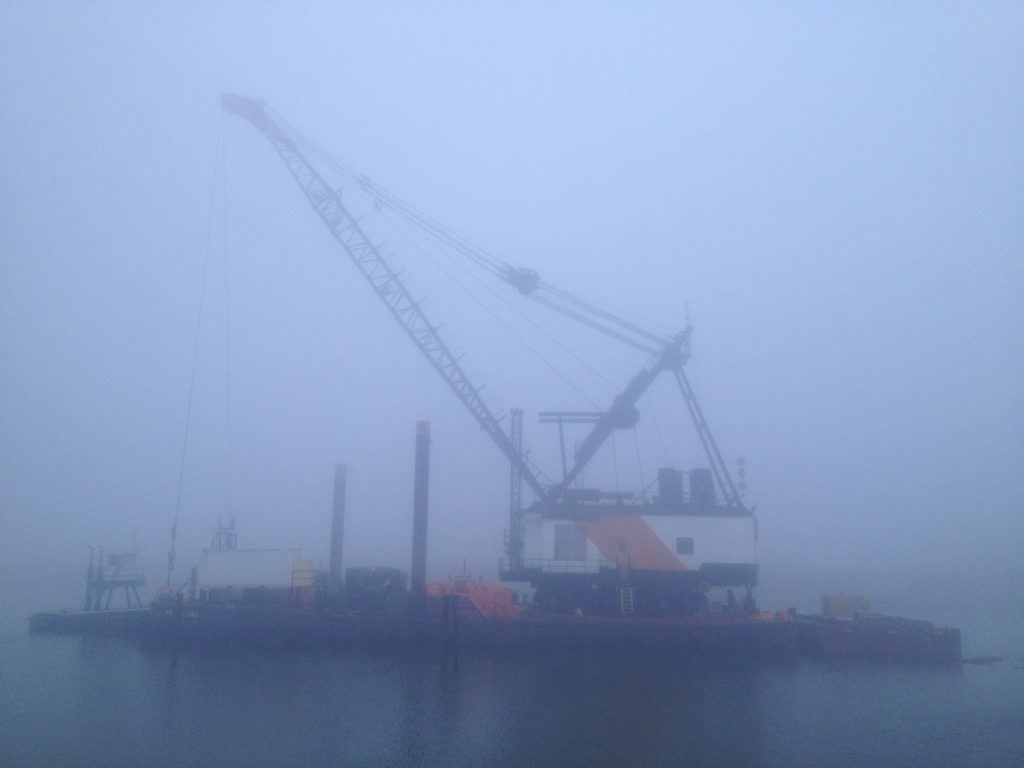
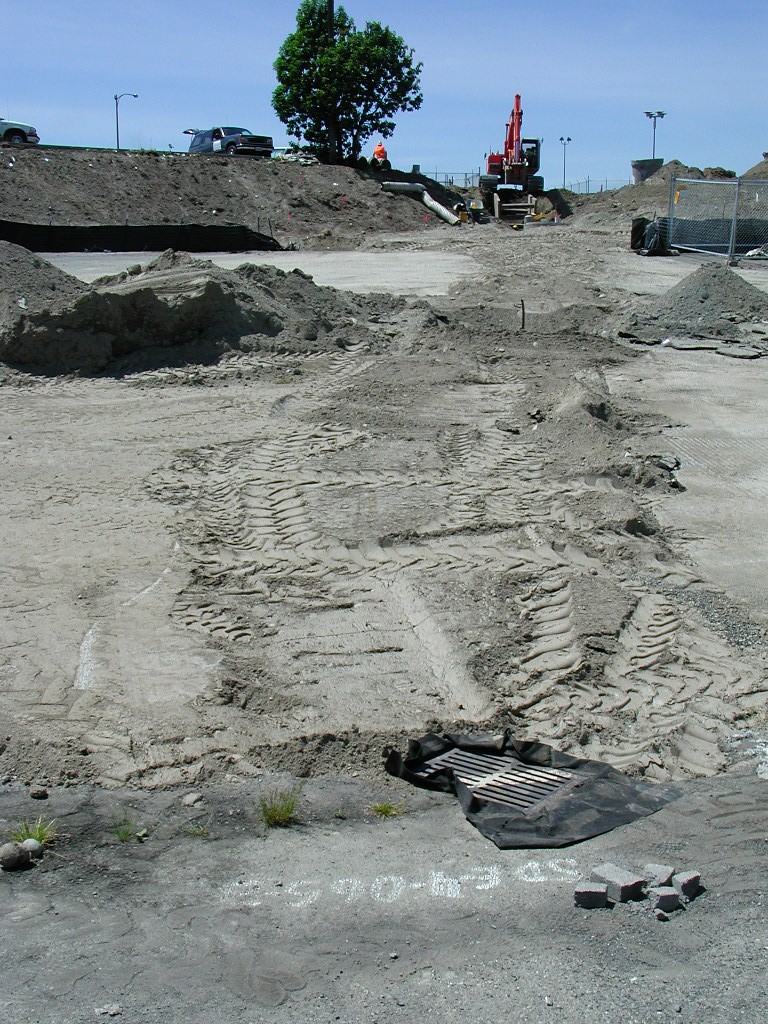
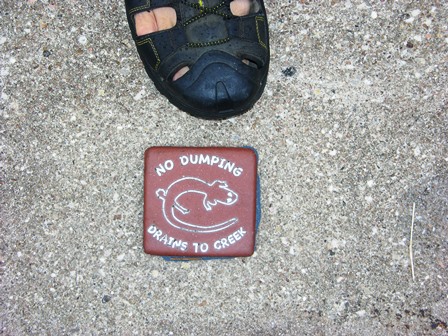
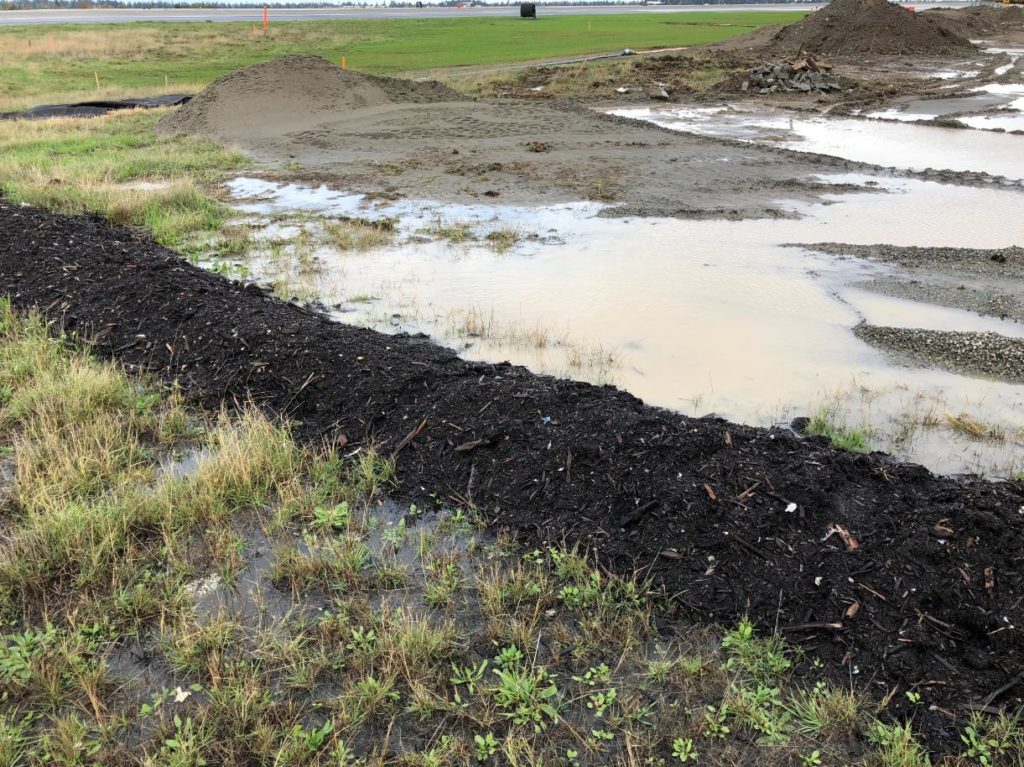
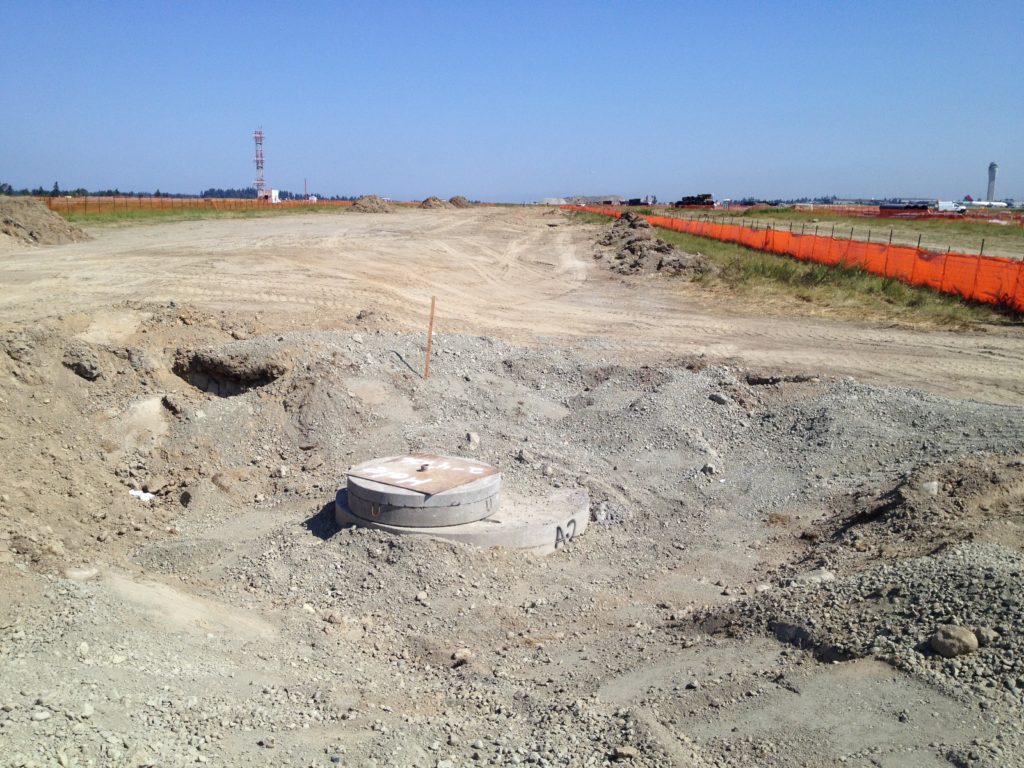
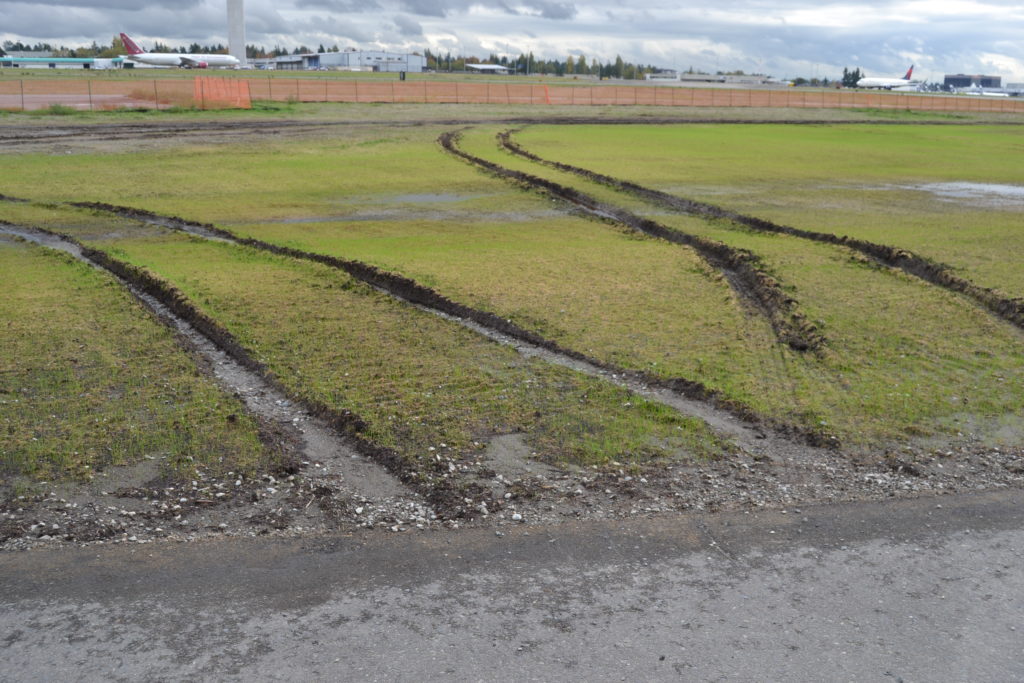
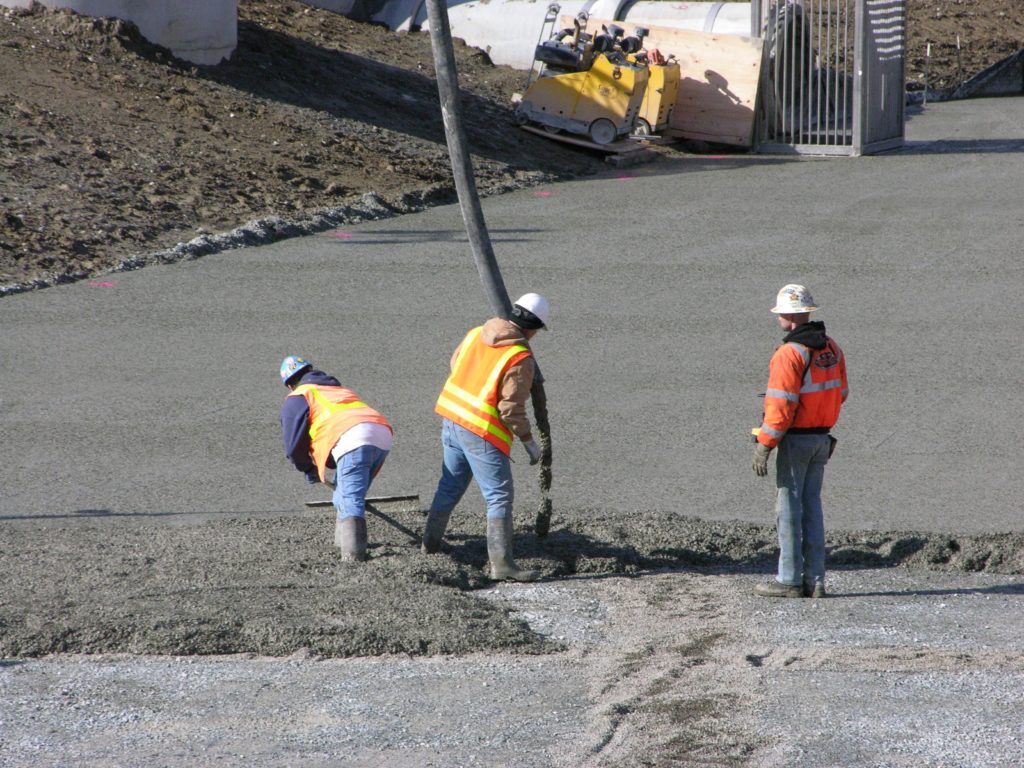
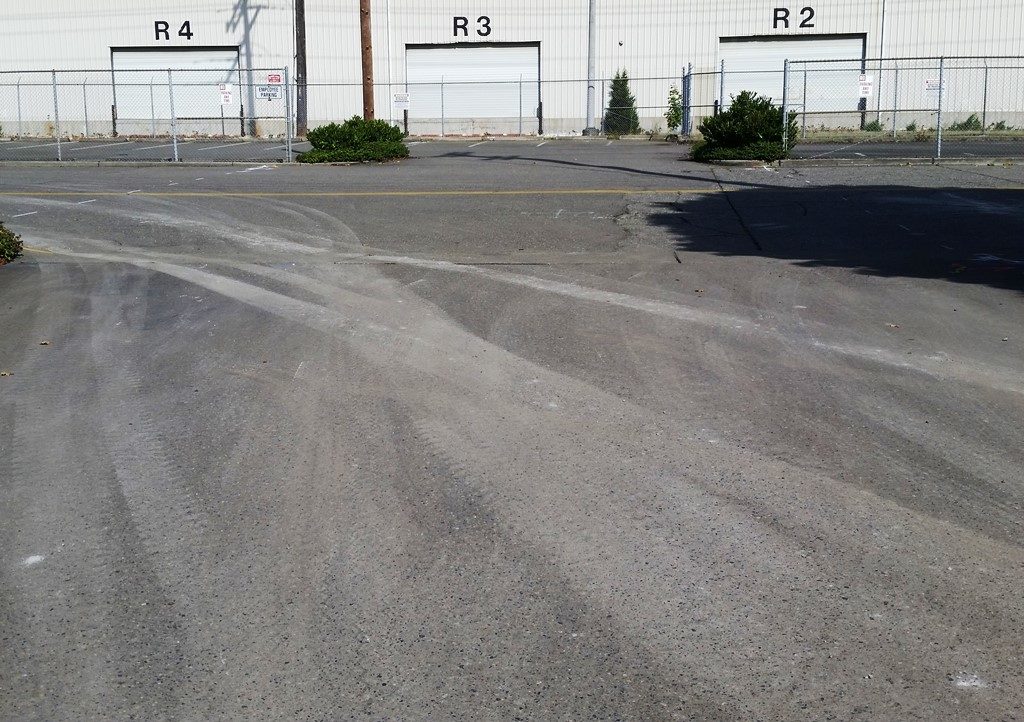
One the benefits of working construction at an airport is taking photos from places most people can’t go. This was taken Summer 2015 during the 16 Center Runway reconstruction.
All photos may be used for teaching and training purposes with attribution to: David Jenkins, sheetflow.com
Photos may not be used for commercial purposes without prior express permission from David Jenkins, sheetflow.com


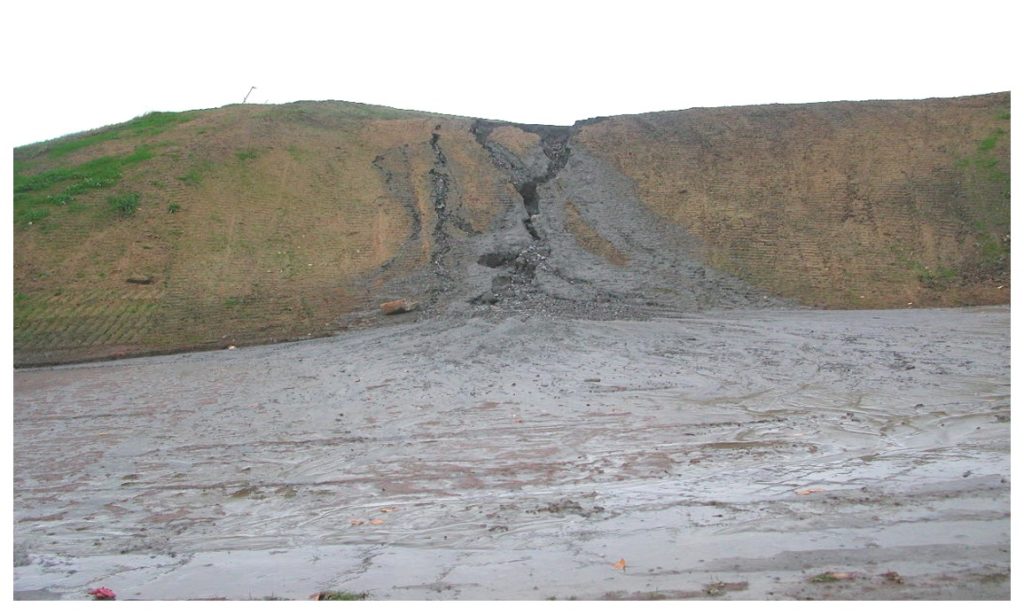


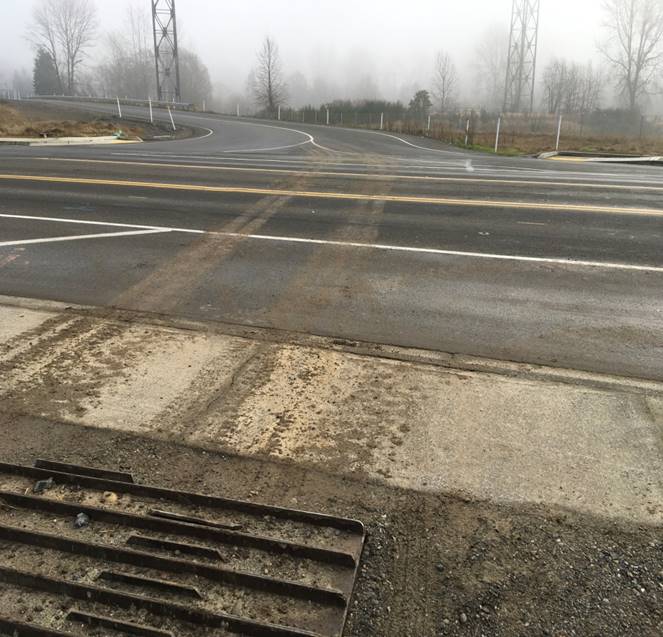


Putting aside the cross-Pacific radiation issues for this blog (again, absolutely no reason to be concerned here on the West Coast), we have had notable very heavy precipitation during the past several days. Slides have stopped north-south train traffic, strong thunderstorms with thunder and lightning have pummeled the lowlands, and some mudslides have blocked local roadways. Slides on the rail right of ways has become a major problem–take a look at the video on the side bar (to the right) to view a typical NW landslide on to the tracks between Seattle and Edmonds.
Lets start with the precipitation over the last two weeks at Sea-Tac (see graph):  roughly twice normal–so half way through the month we have “enjoyed” a normal whole month’s total.
Here is the cumulative precipitation (top figure) this season for the Cedar/Tolt rivers (the main water supply of Seattle). Yes, we are ahead of normal (consistent with La Nina). The bottom panel shows snowpack for these watersheds–rapidly catching up to normal after being well below normal. You will be able to water your lawn this summer.
 Looking at the precipitation for the last 48h from Seattle Rainwatch
 An amazing 4 to 6 inches from north Seattle westward. No wonder there were slides on those tracks!
For days we have been getting very heavy bands of convective showers moving through. Take today at 2:30 PM (see below). Lots of yellows (heavy rain) and even some reds (downpour and or hail).
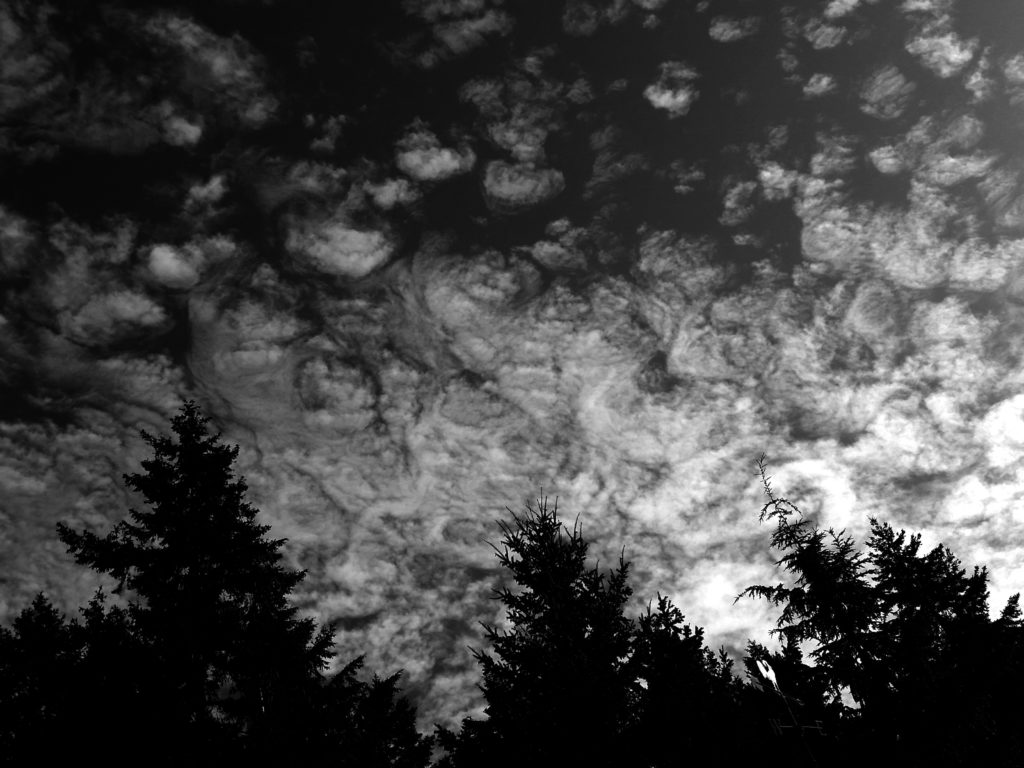
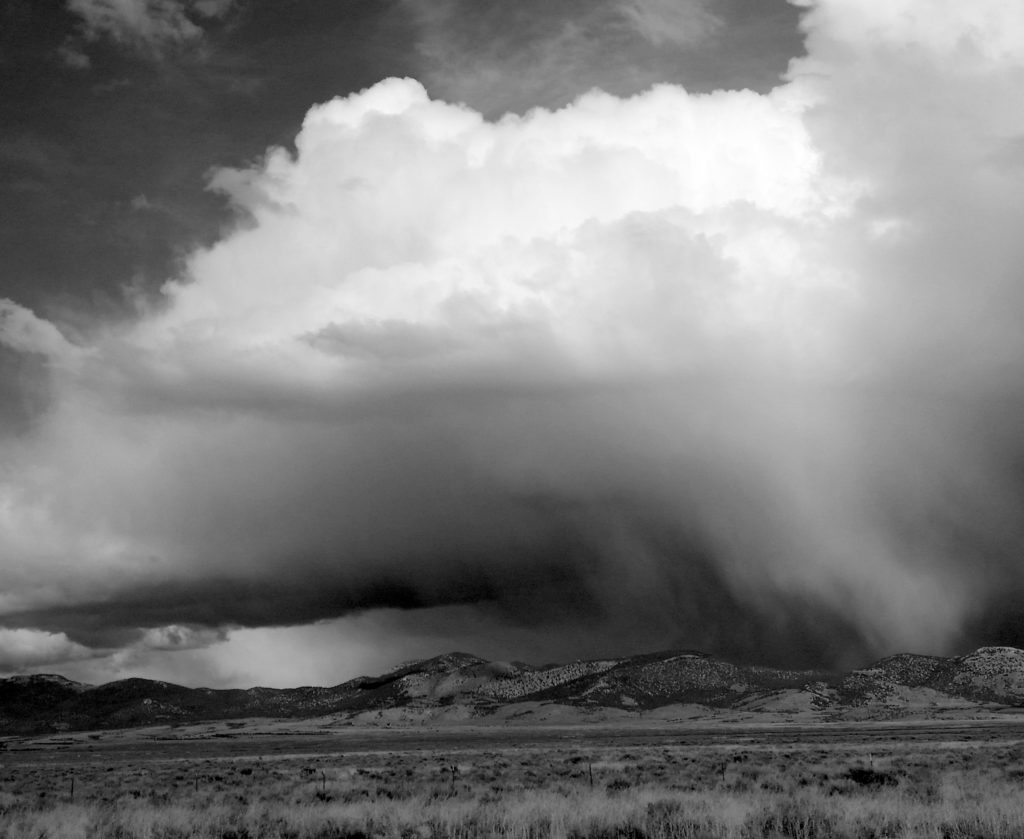
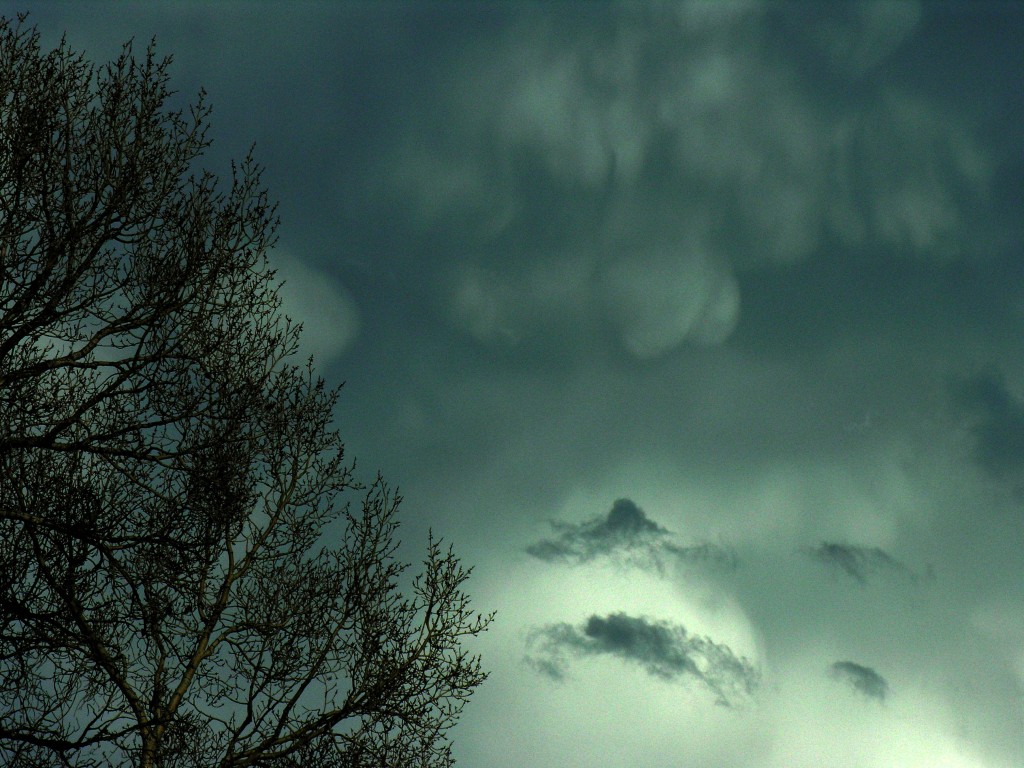
 One very heavy thundershower moved through this afternoon and an image shown on the KOMO-TV website (reproduced below) strongly suggests a rotating “wall cloud”. I would not be surprised at all if someone saw a funnel coming out of this feature.
 More rain tomorrow…but believe or not, Thursday and early Friday should be dry!
Returning briefly to the tsunami issue…it turns out that my idea of building safety towers has been considered for a long time (should have known)…it is called vertical evacuation. There are a few projects being considered on the Oregon and Washington coasts…but nothing sufficient to deal with the problem. What will it take to make the investment to build enough vertical evacuation facilities to have a hope of saving most of our coastal population in case of NW tsunami? This is also homeland security–for a fraction of the funding used to building that fence along the Mexican border we could protect all our coastal folks.
Some amazing rain today…here is the radar image at 9:56 PM tonight…wow…lots of yellows–that is all heavy rain. It is pounding on my roof right now.

And today with the front there was a very intense rainfall band crossing the Sound around noon…here is the radar image. If you look closely, there were some reds in there….a downpour, probably with some small hail mixed in.
 You might be interested in the quantity you are looking at in these images…they are reflectivity–a measure of the scattering of the microwave radiation emitted from the radar. The units are dbZ. You know about dbs on your sound system (db stands for decibel)..a logarithmic system for noting sound volume. This is a logarithmic scale for radar reflectivity.
5-10 greys-light mist or drizzle
15-25 light reds or pinks–light rain
30-35-moderate rain…greens
40-45 -heavy rain…yellows
Above 50–either absolute pouring or hail (reds)
Here is the rain over the past 24-hours from Seattle Rainwatch…some locations have gotten 1.5-2.5 inches today. Nice rainshadow.
One very useful way to look at a time series of meteorological data at a particular point is by ploting the data in a “meteogram.” In a meteogram, time progresses from left to right across the figure. One or more quantites may be plotted, either as line graphs, bar graphs, symbols, numbers, shading, etc. Using a meteogram, one can get a feel of how conditions change and evolve at a stationary point (termed the “Eulerian” perspective). This is handy because most people are rather stationary with respect to the atmosphere (unless you do a lot of traveling), so a person’s natural perspective is Eulerian. Weather maps, or satellite “movies” are good for giving an overall perspective of the “big picture”, but it can be difficult to tell what will transpire in your particular locality.

Keep in mind that like all the other model forecast information provided by COLA, these data are “as is.” They are straight from the computer models at the National Centers for Environmental Research (NCEP) of the National Weather Service. No interpretation, corrections, or other objective or subjective changes have been made. These are not the “official” forecasts, though in most cases they should resemble them rather closely since the official forecasts for your region are based on these models to various extents.
Forecast meteograms are given for selected US cities. In fact, the the forecasts are based on the grid point nearest the city in question. The models cannot directly discern any features of the terrain or atmosphere smaller than the grid resolution (although certain aspects such as the small-scale roughness of the land surface, and the sub-grid scale distribution of thunderstorms are represented indirectly by using parameterizations). Thus these models may not do a good job of forecasting very localized weather such as might be associated with things like mountainous terrain, or sea breezes. MORE…
Thanks to: Weather and Climate Data
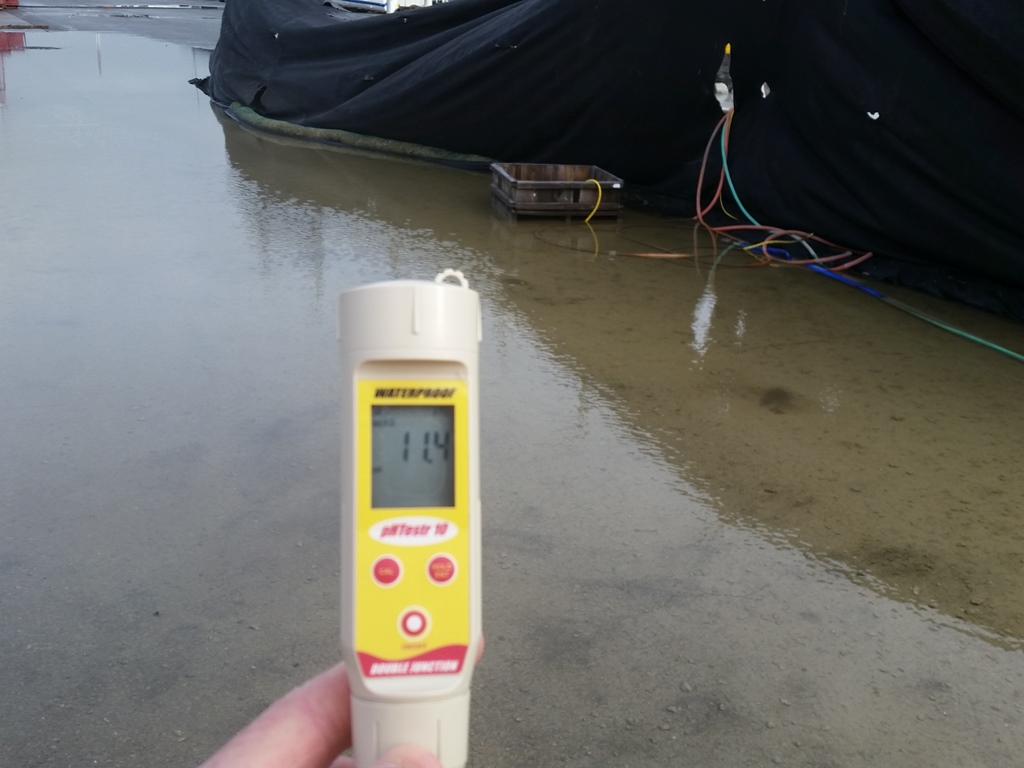
This video by the Washington Stormwater Center, demonstrates how to use and calibrate a turbidity meter, as well with how to set up a water sample for reading, and how to record the results.
Powered by WordPress